Skip navigation

The Nation's Report Card


Writing Overall Results State Comparisons District Results Average Scores Achievement Levels District Comparisons Percentile Rankings Results by Demographic Groups Sample Questions Classroom Context About the Assessment Information For... Media Parents Educators Researchers Policymakers Resources About the Nation's Report Card Data Tools FAQ Contacts
 

Explore urban district results by student groups

The chart below allows comparisons of the average scores or the percentages of public school students performing at or above Basic or Proficient across all participating districts.

Instructions for reading the figure below:

  • Read across the row corresponding to a district listed to the left.
  • The direction of the arrows in the cells indicates whether the district in the row is significantly higher than (up arrow), lower than (down arrow), or not significantly different from (blank cell) the district in the column heading.

To view the interactive features of this map, you may need to download the SVG Viewer or use a specific web browser. See Help for more information.

 Grade 8 Average Scores
Grade 8 Basic
Grade 8 Proficient

Cross-district comparison of average scores in NAEP writing for eighth-grade public school students eligible for the National School Lunch Program: 2007
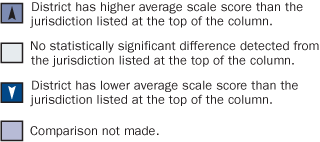
key

NOTE: A student's eligibility for the National School Lunch Program, which offers free or reduced-price lunch to students from lower-income families, is used as an indicator of poverty. Reported differences are statistically significant at the .05 level. View complete data with standard errors in districts and the nation or in large central cities.
SOURCE: U.S. Department of Education, Institute of Education Sciences, National Center for Education Statistics, National Assessment of Educational Progress (NAEP), 2007 Trial Urban District Writing Assessment.

See more information about the writing assessment, including details about participating jurisdictions and percentages of students excluded from the assessment.

To read more about achievement levels and how they are set, see Reporting the Assessment—Scale Scores and Achievement Levels.

See more details on student categories in the NAEP reporting groups.

View TUDA SnapshotView TUDA Snapshot:

Download Writing Report Card Download Writing Report Card