Results of the 2012 National Assessment of Educational Progress (NAEP) long-term trend assessments in reading and mathematics are based on the performance of nationally representative samples of 9-, 13-, and 17-year-olds attending public and private schools. Over 17,000 students at each age were assessed in either reading or mathematics during the 2011-2012 school year.
Results from the long-term trend assessments cannot be directly compared to those from the NAEP main assessments because the long-term trend assessments use different questions and because students are sampled by age rather than by grade. Learn more about differences between the two NAEP assessments.
The assessments provide a unique opportunity to look back on student performance across more than four decades. Results are available for 12 previous reading assessments dating back to 1971, and for 11 previous mathematics assessments dating back to 1973.
Changes in the Student Population
Changes in student demographics provide context for interpreting changes in performance. A notable change in the racial/ethnic makeup of the student population over the past four decades is the increased percentage of Hispanic students. For example, the percentage of 13-year-old Hispanic students has more than tripled from 1978 to 2012. Use the tabs below to explore the changes in demographics by racial/ethnic groups, the highest level of parental education, and grade level of students.
Percentage distribution of 13-year-old students assessed in NAEP mathematics, by race/ethnicity: 1978 and 2012

See complete data for age 9, age 13, and age 17.
Percentage distribution of 13-year-old students assessed in NAEP mathematics, by highest level of parental education: 1978
and 2012

Percentage distribution of 13-year-old students assessed in NAEP mathematics, by grade attended: 1978 and 2012

# Rounds to zero.
Note: Percentages of students are based on information collected as part of the long-term trend mathematics assessment at age 13. Detail may not sum to totals because results are not shown for students whose race/ethnicity was categorized as “other.”
Results at a Glance
Explore the charts below to see how students have performed in reading and mathematics compared to the first assessment years and to the latest assessment in 2008. For example, 9-year-old Black students made a 36-point gain in their reading score compared to 1971.
Changes in NAEP reading average scores and score gaps for 9-, 13-, and 17-year-old students, by selected characteristics: various years
 13 13 |
8 |
 |
|
3 |
|
| 15 |
9 |
4 |
|
|
|
| 36 |
24 |
30 |
|
|
|
| 25 |
17 |
21 |
|
7 |
|
| 17 |
9 |
4 |
|
|
|
| 10 |
6 |
|
|
3 |
|
| Narrowed |
Narrowed |
Narrowed |
|
|
|
| Narrowed |
Narrowed |
Narrowed |
|
Narrowed |
|
| Narrowed |
|
|
|
|
|
|
Changes in NAEP mathematics average scores and score gaps for 9-, 13-, and 17-year-old students, by selected characteristics: various years
 25 25 |
19 |
 |
|
4 |
|
| 27 |
19 |
4 |
|
|
|
| 36 |
36 |
18 |
|
|
|
| 32 |
32 |
17 |
|
|
|
| 26 |
21 |
|
|
|
|
| 24 |
17 |
3 |
|
5 |
|
| Narrowed |
Narrowed |
Narrowed |
|
|
|
|
Narrowed |
Narrowed |
|
|
|
|
|
Narrowed |
|
|
|
|
1 Reading results for Hispanic students were first available in 1975. Therefore, the results shown in the 1971 section for Hispanic students are from the 1975 assessment.
2 Score differences between male and female students in mathematics were not found to be statistically significant (p < .05) at age 9 in 1973, 2008, or 2012, and at age 13 in 1973 and 2012.
NOTE: Black includes African American, and Hispanic includes Latino. Race categories exclude Hispanic origin.
Complete Trend Lines
Both 9- and 13-year-olds scored higher in reading and mathematics in 2012 than students their age in the early 1970s. Average reading and mathematics scores in 2012 for 17-year-olds were not significantly different from scores in the first assessment year.
Trend in NAEP reading average scores for 9-, 13-, and 17-year-old students
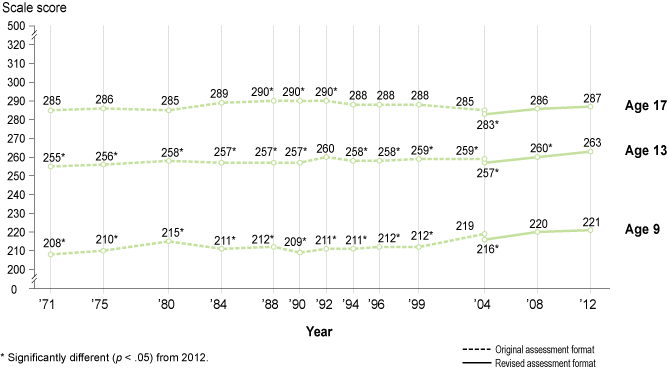
See complete data for age 9, age 13, and age 17.
Trend in NAEP mathematics average scores for 9-, 13-, and 17-year-old students
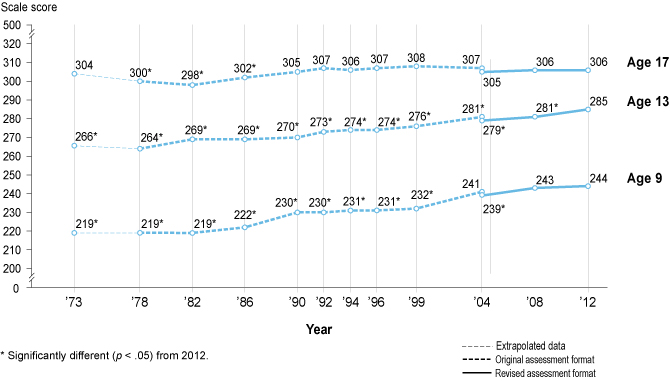
See complete data for age 9, age 13, and age 17.