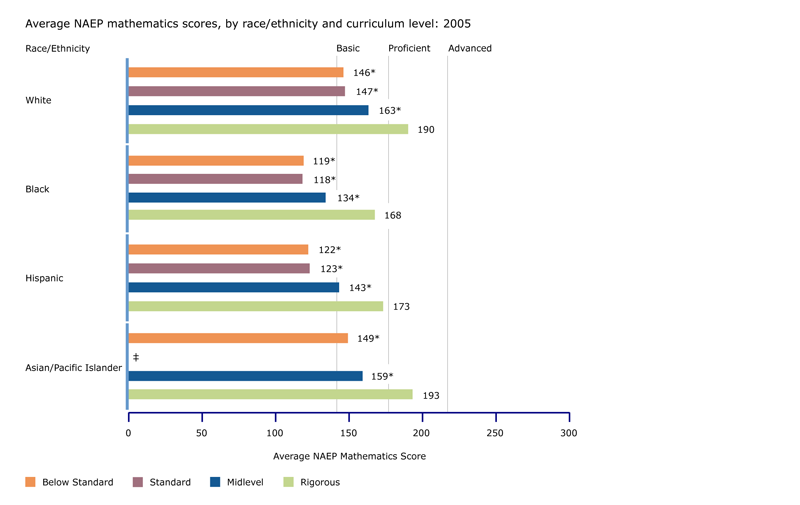
‡ Reporting standards not met.
* Significantly different (p<.05) from graduates who attained a rigorous curriculum.
NOTE: Black includes African American, Hispanic includes Latino, and Pacific Islander includes Native Hawaiian. Race categories exclude Hispanic origin unless specified.
SOURCE: U.S. Department of Education, Institute of Education Sciences, National Center for Education Statistics, High School Transcript Study (HSTS), 2005; National Assessment of Educational Progress (NAEP), 2005 Mathematics Assessment

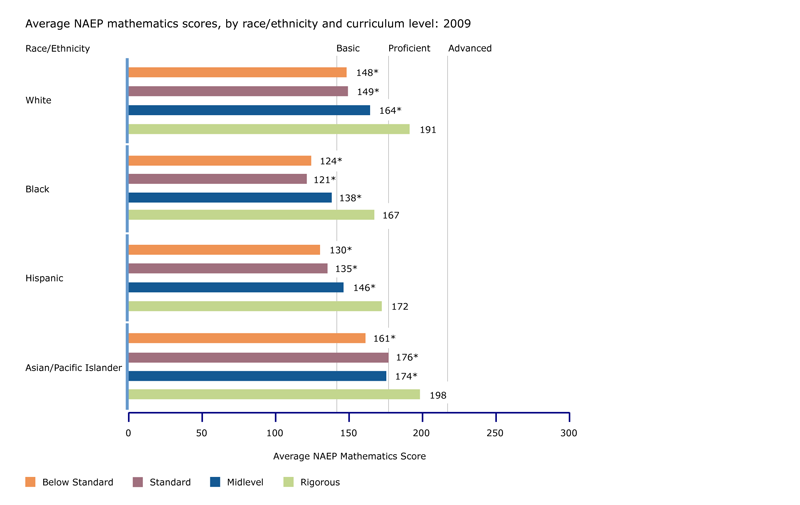
* Significantly different (p<.05) from graduates who attained a rigorous curriculum.
NOTE: Black includes African American, Hispanic includes Latino, and Pacific Islander includes Native Hawaiian. Race categories exclude Hispanic origin unless specified.
SOURCE: U.S. Department of Education, Institute of Education Sciences, National Center for Education Statistics, High School Transcript Study (HSTS), 2009; National Assessment of Educational Progress (NAEP), 2009 Mathematics Assessment
Average NAEP mathematics scores, by race/ethnicityand curriculum level: 2005 and 2009
| Average NAEP mathematics score |
Standard error |
Average NAEP mathematics score |
Standard error |
|---|
| Below standard |
146 |
* |
(1.5) |
148 |
* |
(1.5) |
|---|
| Standard |
147 |
* |
(1.4) |
149 |
* |
(1.3) |
|---|
| Midlevel |
163 |
* |
(0.9) |
164 |
* |
(0.7) |
|---|
| Rigorous |
190 |
|
(1.5) |
191 |
|
(0.9) |
|---|
| Below standard |
119 |
* |
(2.5) |
124 |
* |
(1.5) |
|---|
| Standard |
118 |
* |
(2.8) |
121 |
* |
(1.9) |
|---|
| Midlevel |
134 |
* |
(1.9) |
138 |
* |
(1.0) |
|---|
| Rigorous |
168 |
|
(4.6) |
167 |
|
(2.1) |
|---|
| Below standard |
122 |
* |
(1.8) |
130 |
* |
(1.1) |
|---|
| Standard |
123 |
* |
(4.0) |
135 |
* |
(1.8) |
|---|
| Midlevel |
143 |
* |
(1.4) |
146 |
* |
(1.0) |
|---|
| Rigorous |
173 |
|
(3.9) |
172 |
|
(2.3) |
|---|
| Below standard |
149 |
* |
(4.8) |
161 |
* |
(4.2) |
|---|
| Standard |
† |
|
† |
176 |
* |
(4.3) |
|---|
| Midlevel |
159 |
* |
(3.5) |
174 |
* |
(3.9) |
|---|
| Rigorous |
193 |
|
(4.1) |
198 |
|
(2.4) |
|---|
‡ Reporting standards not met.
* Significantly different (p<.05) from graduates who attained a rigorous curriculum.
NOTE: Black includes African American, Hispanic includes Latino, and Pacific Islander includes Native Hawaiian. Race categories exclude Hispanic origin unless specified.
SOURCE: U.S. Department of Education, Institute of Education Sciences, National Center for Education Statistics, High School Transcript Study (HSTS), 2005 and 2009; National Assessment of Educational Progress (NAEP), 2005 and 2009 Mathematics Assessment.