|
Below are your responses and sample student responses from the assessment. See how your responses compare to the actual national response data from the assessment. More information about each question is available in the NAEP Questions Tool.
Which of the following is an equation of a line that passes through the point (0, 5) and has a negative slope?
A. y = 5x
B. y = 5x - 5
C. y = 5x + 5
D. y = -5x - 5
E. y = -5x + 5
Your answer:
The correct answer: E
Response commentary:
This question asks students to identify the equation of a line that satisfies two conditions: the graph of the line passes through a given point, and it has a negative slope. The given point is the y-intercept of the graph of the line, and all answer choices were presented in slope-intercept form. Students were not permitted to use a calculator to answer this question.
The correct answer (Choice E) was chosen by 31 percent of eighth-grade students. Students who correctly answered this question were able to recognize properties of a line written in slope-intercept form.
The equations in the incorrect answer choices had the following properties:
- Choice A is an equation of a line having a positive slope and y-intercept at (0, 0),
- Choice B is an equation of a line having a positive slope and y-intercept at (0, -5),
- Choice C is an equation of a line with the correct y-intercept at (0, 5), but the slope is positive, and
- Choice D is an equation of a line having a negative slope, but an incorrect y-intercept at (0, -5).
Percentage of eighth-grade students in each response category: 2011
| Choice A |
Choice B |
Choice C |
Choice D |
Choice E |
Omitted |
| 12 |
27 |
9 |
20 |
31 |
1 |
See more information about this question in the NAEP Questions Tool.
The circular spinner shown below is divided into 6 congruent sectors. The sectors are yellow or blue.

Label each of the sectors either yellow (Y) or blue (B) so that the probability of spinning the arrow once and landing on
yellow is  . .
Your answer:
Sample "Correct" response:
Response commentary:
This question asks students to label the sectors of a spinner (either yellow or blue) that has been divided into 6 congruent sectors to match a given probability. To answer this question correctly, students must determine how many of the sectors need to be labeled yellow and how many sectors need to be labeled blue, so that the probability of spinning the arrow one time and landing on a sector labeled yellow is 1/3. Students who correctly answered this question recognized that the given probability, 1/3, needed to be converted to sixths to correspond to the 6 sectors on the spinner. Since 1/3 is equivalent to 2/6, a total of 2 sectors need to be labeled yellow, and the remaining 4 sectors need to be labeled blue. Students were permitted to use a calculator to solve this question. Responses were rated using two scoring levels.
Percentage of eighth-grade students in each response category: 2011
| Correct |
Incorrect |
Omitted |
| 52 |
46 |
2 |
See more information about this question in the NAEP Questions Tool.

In the figure above, line  is parallel to line m. Which of the following pairs of angles must have the same measure? is parallel to line m. Which of the following pairs of angles must have the same measure?
A. Angles 1 and 2
B. Angles 1 and 5
C. Angles 2 and 3
D. Angles 4 and 5
E. Angles 4 and 8
Your answer:
The correct answer: D
Response commentary:
In this question, students are presented with a set of parallel lines cut by a non-perpendicular transversal and are asked to identify a pair of angles that must have the same measure. This question requires students to use properties of parallel lines and transversals to recognize pairs of congruent angles. Students were not permitted to use a calculator to answer this question.
Seventy-one percent of eighth-graders were able to correctly identify that angles 4 and 5 must have the same measure (Choice D). The other answer choices represent different pairs of supplementary angles. The most common incorrect answer (Choice C) was selected by 15 percent of students and may have been selected more frequently because it is the only choice where the pair of angles is consecutive.
Percentage of eighth-grade students in each response category: 2011
| Choice A |
Choice B |
Choice C |
Choice D |
Choice E |
Omitted |
| 4 |
5 |
15 |
71 |
4 |
1 |
See more information about this question in the NAEP Questions Tool.
The linear graph below describes Josh’s car trip from his grandmother’s home directly to his home.

(a) Based on this graph, what is the distance from Josh’s grandmother’s home to his home?
Your answer:
Sample "Extended" response:
(b) Based on this graph, how long did it take Josh to make the trip?
Your answer:
Sample "Extended" response:

(c) What was Josh’s average speed for the trip? Explain how you found your answer.
Your answer:
Sample "Extended" response:
(d) Explain why the graph ends at the x-axis.
Your answer:
Sample "Extended" response:
Response commentary:
This question measures eighth-graders’ performance in the algebra content area. Students are given the graph of a line that represents distance as a function of time for a car trip, and the students are asked to interpret characteristics of the graph based on this context. Students were permitted to use a calculator to solve this question.
There are four parts to this question. In this context, the x-axis represents the elapsed time for the car trip (in hours) and the y-axis represents the distance (in miles) traveled from home. Therefore, each point (x, y) on the graph of the line corresponds to an amount of time driven, x, and a distance from home, y.
- Part a: The answer to this part of the question is 160 miles, which can be determined by noting that the y-intercept of the graph is (0, 160). In context, this point corresponds to the starting location of the trip, when he has been driving for zero hours.
- Part b: The answer to this part of the question is 4 hours, which can be determined by noting that the x-intercept of the graph is (4, 0). In context, this point corresponds to the end of the trip because the distance he is from home is now zero miles.
- Part c: The answer to this part of the question is 40 miles per hour, which can be determined by computing the absolute value of the slope of the line (since speed is always a positive value). Josh drove a total distance of 160 miles in 4 hours, which is equal to an average speed of 40 miles per hour (160 miles ÷ 4 hours).
- Part d: Any point on the x-axis represents a distance of zero miles from Josh’s home, so in the context of this problem, he can drive no farther. Also, in this context, if the graph of the line were to extend below the x-axis it would represent the meaningless context of negative distance.
Each part to this question was rated independently, and then the separate ratings were mapped to a composite score. Parts a, b, and d were each rated using two score categories: correct or incorrect. Part c was rated using three score categories: correct, partial, or incorrect.
Percentage of eighth-grade students in each response category: 2011
| Extended |
Satisfactory |
Partial |
Minimal |
Incorrect |
Omitted |
| 11 |
41 |
34 |
7 |
3 |
4 |
See more information about this question in the NAEP Questions Tool.
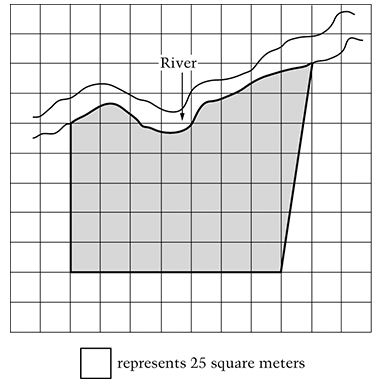
On the scale drawing above, the shaded area represents a piece of property along the river. Which of the following measurements is the best estimate of the area of the property?
A. 750 square meters
B. 850 square meters
C. 900 square meters
D. 1,050 square meters
E. 1,200 square meters
Your answer:
The correct answer: D
Response commentary:
This question measures student performance in the measurement content area. To answer this question, students needed to determine the approximate number of whole squares in the region and then multiply this by 25. There are approximately 40 shaded squares in the region so the correct answer is 1,050 square meters (Choice D). Students were permitted to use a calculator to answer this question.
The correct answer was selected by forty-one percent of eighth-grade students. There are 34 squares in the region that are completely shaded, with an area of 850 square meters (Choice B). The most frequently selected incorrect answer was 900 square meters (Choice C), which is the answer choice that is closest to, but greater than the area represented by the squares that are completely shaded. Choice E may have been the result of estimating the area by counting the number of squares that contained any amount of shading.
Percentage of eighth-grade students in each response category: 2011
| Choice A |
Choice B |
Choice C |
Choice D |
Choice E |
Omitted |
| 10 |
13 |
20 |
41 |
15 |
1 |
See more information about this question in the NAEP Questions Tool.
For 2 minutes, Casey runs at a constant speed. Then she gradually increases her speed. Which of the following graphs could show how her speed changed over time?
A. 
B. 
C.
D. 
E. 
Your answer:
The correct answer: D
Response commentary:
This question measures eighth-grade students’ performance in the algebra content area. Students are told that Casey runs at a constant speed for two minutes, and then gradually increases her speed. Students have to use this information to identify a graph that could represent this scenario. All the answer choices are graphs with speed on the vertical axis and time on the horizontal axis. Students were permitted to use a calculator to answer this question.
The correct graph is Choice D and was selected by 70 percent of eighth-graders. The most frequently selected incorrect answer choice was Choice B, which shows a graph where the runner’s speed is never constant and is instead changing at two different rates.
Percentage of eighth-grade students in each response category: 2011
| Choice A |
Choice B |
Choice C |
Choice D |
Choice E |
Omitted |
| 2 |
24 |
1 |
70 |
2 |
1 |
See more information about this question in the NAEP Questions Tool.

A recipe requires  cups of sugar. Which of the following ways describes how the measuring cups shown can be used to measure cups of sugar accurately? cups of sugar. Which of the following ways describes how the measuring cups shown can be used to measure cups of sugar accurately?
A. Use the  cup three times cup three times
B. Use the  cup three times cup three times
C. Use the cup twice and the cup once.
D. Use the cup twice and the cup once.
E. Use the cup once, the cup once, and the cup once.
Your answer:
The correct answer: C
Response commentary:
This question is from the number properties and operations content area. Students were permitted to use a calculator to answer this question.
The answer is “Use the cup twice and the cup once.” (Choice C). Eighty percent of eighth-grade students selected the correct answer.
The other answer choices result in the following incorrect amounts:
- Use the cup 3 times (Choice A) would result in a total of 1 cups of sugar.
- Use the cup 3 times (Choice B) would result in a total of
 of a cup of sugar. of a cup of sugar.
- Use the cup twice and the cup once (Choice D) would result in a total of
 cups of sugar. cups of sugar.
- Use the cup once, the cup once, and the cup once. (Choice E) would result in a total of
 cups of sugar. cups of sugar.
The most common incorrect answer choice was Choice D.
Percentage of eighth-grade students in each response category: 2011
| Choice A |
Choice B |
Choice C |
Choice D |
Choice E |
Omitted |
| 4 |
4 |
80 |
7 |
4 |
1 |
See more information about this question in the NAEP Questions Tool.
|