 Twenty-one percent of 2009 graduates were enrolled in summer school at some point during high school.
 Graduates who took summer school classes earned lower average scores on the NAEP twelfth-grade mathematics and science assessments than graduates who did not take summer school classes.
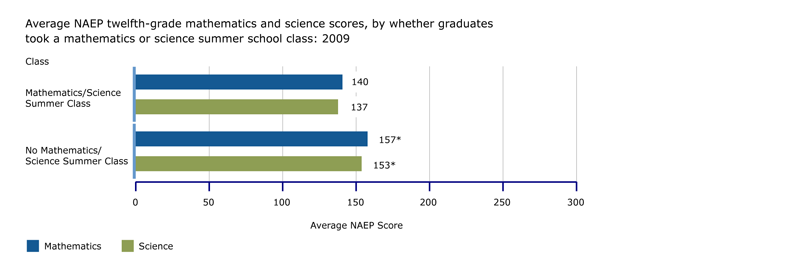
 Graduates who took summer classes in mathematics or science, on average, scored lower on the NAEP twelfth-grade mathematics and science assessments than graduates who did not take summer school classes in these subjects.
Percentage of graduates taking summer school, by selected student characteristics: 2009
| Graduates taking summer school |
| Percentage of graduates |
Standard error |
|---|
| Male |
22.3 |
|
(0.85) |
|---|
| Female |
20.6 |
* |
(0.80) |
|---|
| White |
14.3 |
|
(0.85) |
|---|
| Black |
25.7 |
* |
(1.50) |
|---|
| Hispanic |
39.5 |
* |
(2.08) |
|---|
| Asian/Pacific Islander |
35.6 |
* |
(2.59) |
|---|
| Below standard |
30.3 |
|
(1.25) |
|---|
| Standard |
18.2 |
* |
(1.15) |
|---|
| Midlevel |
18.8 |
* |
(0.92) |
|---|
| Rigorous |
16.2 |
* |
(1.41) |
|---|
* Significantly different (p<.05) from base groups (Male, White, Below standard).
SOURCE: U.S. Department of Education, Institute of Education Sciences, National Center for Education Statistics, High School Transcript Study (HSTS), 2009.

* Significantly different (p<.05) from graduates who took a summer school class.
SOURCE: U.S. Department of Education, Institute of Education Sciences, National Center for Education Statistics, High School Transcript Study (HSTS), 2009; National Assessment of Educational Progress (NAEP) 2009 Mathematics and Science Assessments.
Average NAEP twelfth-grade mathematics and science scores, by summer school status: 2009
| Mathematics |
Science |
| Average NAEP score |
Standard error |
Average NAEP score |
Standard error |
|---|
| Summer school |
149 |
|
(1.0) |
148 |
|
(1.5) |
|---|
| No summer school |
158 |
* |
(0.7) |
154 |
* |
(1.0) |
|---|
* Significantly different (p<.05) from graduates who took a summer school class.
SOURCE: U.S. Department of Education, Institute of Education Sciences, National Center for Education Statistics, High School Transcript Study (HSTS), 2009; National Assessment of Educational Progress (NAEP) 2009 Mathematics and Science Assessments.

* Significantly different (p<.05) from graduates who took a mathematics or science summer school class.
SOURCE: U.S. Department of Education, Institute of Education Sciences, National Center for Education Statistics, High School Transcript Study (HSTS), 2009; National Assessment of Educational Progress (NAEP) 2009 Mathematics and Science Assessments.
Average NAEP twelfth-grade mathematics and science scores, by whether graduates took a mathematics or science summer school class: 2009
| Mathematics |
Science |
| Average NAEP score |
Standard error |
Average NAEP score |
Standard error |
|---|
| Mathematics/science summer class |
140 |
|
(1.2) |
137 |
|
(2.3) |
|---|
| No mathematics/science summer class |
157 |
* |
(0.7) |
153 |
* |
(0.9) |
|---|
* Significantly different (p<.05) from graduates who took a mathematics or science summer school class.
NOTE: Black includes African American, Hispanic includes Latino, Pacific Islander includes Native Hawaiian. Race categories exclude Hispanic origin.
SOURCE: U.S. Department of Education, Institute of Education Sciences, National Center for Education Statistics, High School Transcript Study (HSTS), 2009; National Assessment of Educational Progress (NAEP) 2009 Mathematics and Science Assessments.