Science Summary
The NAEP science assessment was administered at the state level at grade 4 in 2009 and at grade 8 in 2009 and 2011. The NAEP Science Framework, the blueprint for the assessment, organizes science content into three broad content areas: physical science, life science, and Earth and space sciences, reflecting the science curriculum students are generally exposed to across the grades K through 12. For more information about the assessment, explore what the science assessment measures.
Grade 4
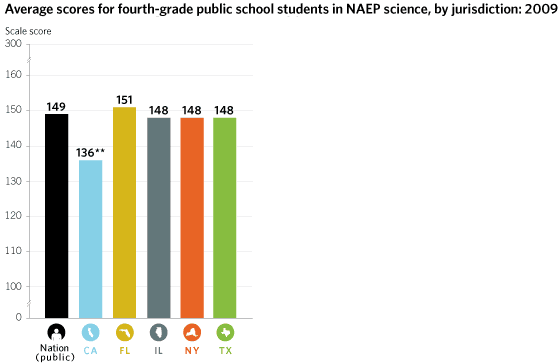
Comparisons to the nation in 2009
** Significantly different (p < .05) from the nation and the other Mega-States. Grade 8
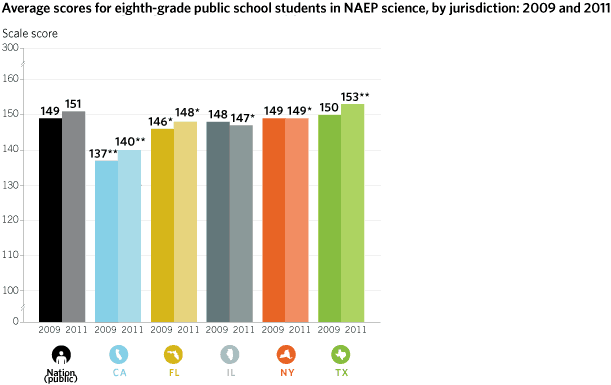
Trend results
Comparisons to the nation in 2011
* Significantly different (p < .05) from the nation.
Demographics of the Mega-StatesIn the 2009 data shown below for grade 4 and the 2011 data for grade 8, the Mega-States differed in the relative proportions of various student groups in NAEP science. At grade 4 for example, the percentages of Hispanic students ranged from 20 percent in New York to 51 percent in California and Texas. At grade 8, the percentages of students attending city schools ranged from 22 percent in Florida to 45 percent in California.
SOURCE: U.S. Department of Education, Institute of Education Sciences, National Center for Education Statistics, National Assessment of Educational Progress (NAEP), 2009 and 2011 Science Assessments. | |||||||||||||||||||||||||||||||||||||||||||||||||||||||||||||||||||||||||||||||||||||||||||||||||||||||||||||||||||||||||||||||||||||||||||||||||||||||||||||||||||||||||||||||||||||||||||||||||||||||||||||||||||||||||||||||||||||||||||||||||||||||||||||||||||||||||||||||||||||||||||||||||||||||||||||||||||||||||||||||||||||||||||||||||||||||||||||||||||||||||||||||||||||||||||||||||||||||||||||||||||||||||||||||||||||||||||||||||||||||||||||

