|
|
 5 of 12 5 of 12 
|
|
District Reading Results by Race/Ethnicity
At grade 4, compared to students of the same race/ethnicity in large central city schools...
-
White students in Atlanta, Austin, Charlotte, the District of Columbia, and Houston had higher average scores. White students in Cleveland had a lower average score.
-
Black students in Boston, Charlotte, Houston, and New York City had higher average scores. Black students in Chicago, the District of Columbia, and Los Angeles had lower average scores.
-
Hispanic students in Austin, Charlotte, and New York City had higher average scores. Hispanic students in Los Angeles had a lower average score.
-
Asian/Pacific Islander students in New York City had a higher average score.
At grade 8, compared to students of the same race/ethnicity in large central city schools…
-
White students in Austin, Charlotte, the District of Columbia, and Houston had higher average scores.
-
Black students in the District of Columbia had a lower average score.
-
Hispanic students in Chicago had a higher average score. Hispanic students in Los Angeles had a lower average score.
-
Asian/Pacific Islander students in Boston had a higher average score.
|
Grade 4
- White Students
- Black Students
- Hispanic Students
- Asian/Pacific Islander Students
- White-Black Gap
- White-Hispanic Gap
- Distribution of Student Groups
Average scale scores and percentage of White students within each achievement level in reading,
grade 4 public schools: By urban district, 2005
Average scale scores and percentage of Black students within each achievement level in reading, grade 4 public schools: By urban district, 2005
Average scale scores and percentage of Hispanic students within each achievement level in reading, grade 4 public schools: By urban district, 2005
Average scale scores and percentage of Asian/Pacific Islander students within each achievement level in reading, grade 4 public schools: By urban district, 2005
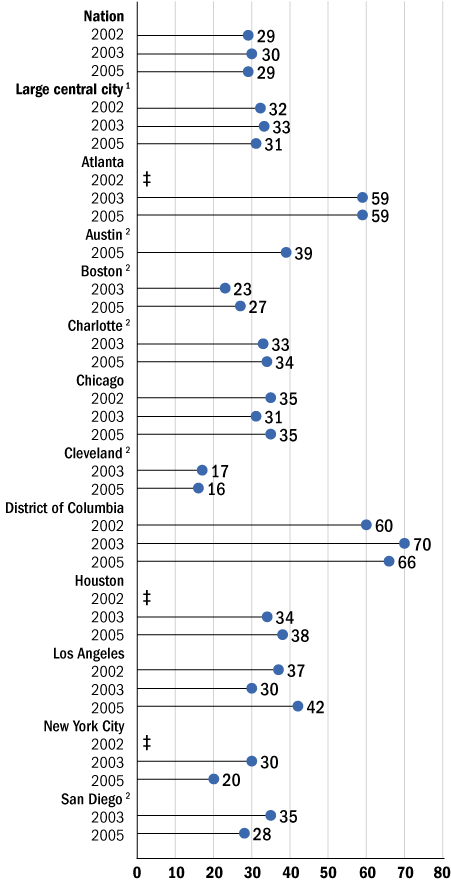
White-Black gap in average reading scores, grade 4 public schools: By urban district, various years, 2002–2005
White average score minus Black average score

Score gaps
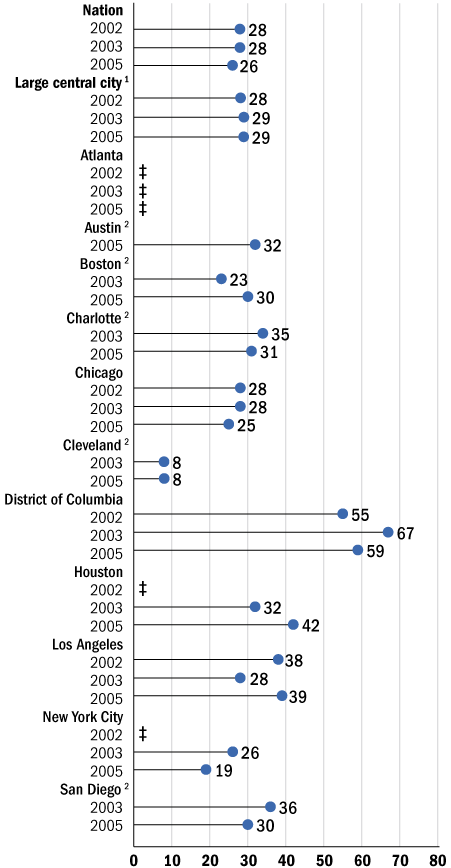
White-Hispanic gap in average reading scores, grade 4 public schools: By urban district, various years, 2002–2005
White average score minus Hispanic average score

Score gaps
Percentage of students by race/ethnicity, reading assessment, grade 4 public schools: By urban district, 2005
| District |
White
|
Black
|
Hispanic
|
Asian/Pacific
Islander
|
American Indian/
Alaska Native
|
Unclassified1
|
|
Nation
|
57 |
17 |
19 |
4 |
1 |
1 |
|
Large central city
|
21 |
32 |
38 |
7 |
1 |
1 |
|
Atlanta
|
11 |
85 |
4 |
1 |
# |
# |
|
Austin
|
30 |
15 |
52 |
3 |
# |
# |
|
Boston
|
12 |
46 |
32 |
10 |
# |
# |
|
Charlotte
|
40 |
43 |
11 |
3 |
1 |
2 |
|
Chicago
|
9 |
48 |
41 |
3 |
# |
# |
|
Cleveland
|
19 |
70 |
9 |
# |
# |
1 |
|
District of Columbia
|
4 |
85 |
9 |
2 |
# |
# |
|
Houston
|
12 |
33 |
51 |
3 |
# |
# |
|
Los Angeles
|
9 |
10 |
74 |
7 |
# |
# |
|
New York City
|
15 |
35 |
38 |
12 |
# |
# |
|
San Diego
|
22 |
12 |
47 |
18 |
# |
# |
Grade 8
- White Students
- Black Students
- Hispanic Students
- Asian/Pacific Islander Students
- White-Black Gap
- White-Hispanic Gap
- Distribution of Student Groups
Average scale scores and percentage of White students within each achievement level in reading, grade 8 public schools: By urban district, 2005
Average scale scores and percentage of Black students within each achievement level in reading, grade 8 public schools: By urban district, 2005
Average scale scores and percentage of Hispanic students within each achievement level in reading, grade 8 public schools: By urban district, 2005
Average scale scores and percentage of Asian/Pacific Islander students within each achievement level in reading, grade 8 public schools: By urban district, 2005
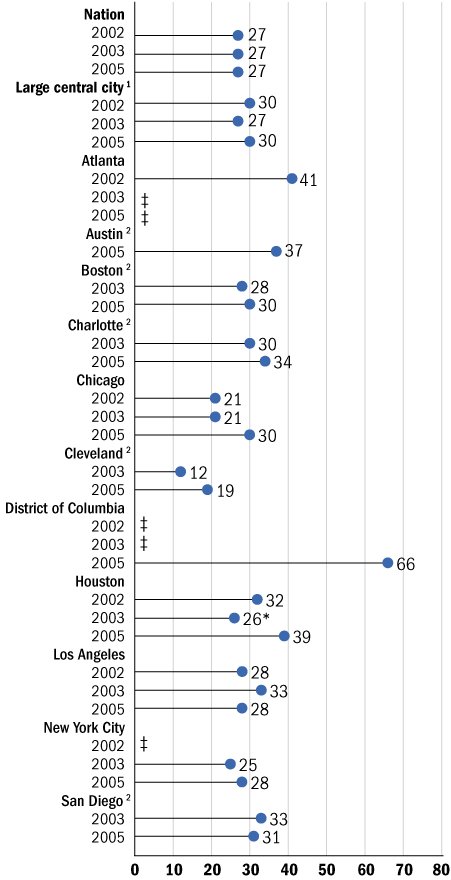
White-Black gap in average reading scores, grade 8 public schools: By urban district, various years, 2002–2005
White average score minus Black average score

Score gaps
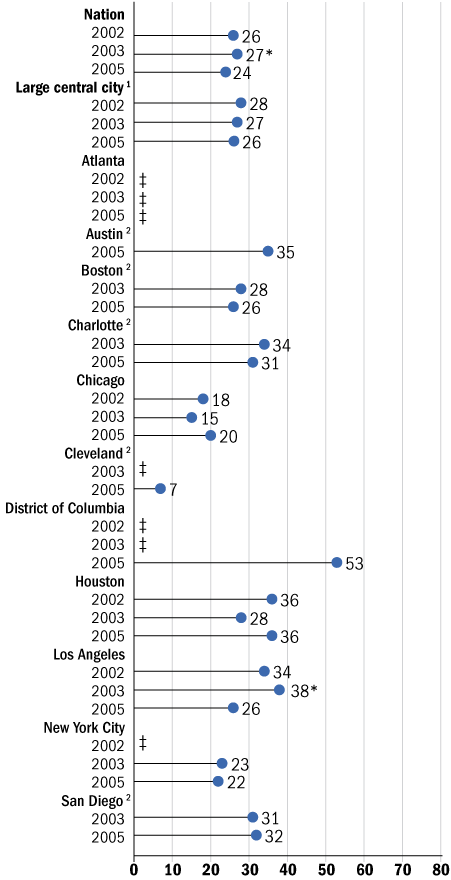
White-Hispanic gap in average reading scores, grade 8 public schools: By urban district, various years, 2002–2005
White average score minus Hispanic average score

Score gaps
Percentage of students by race/ethnicity, reading assessment, grade 8 public schools: By urban district, 2005
| District |
White
|
Black
|
Hispanic
|
Asian/Pacific
Islander
|
American Indian/
Alaska Native
|
Unclassified1
|
|
Nation
|
60 |
17 |
17 |
4 |
1 |
1 |
|
Large central city
|
24 |
32 |
36 |
7 |
1 |
# |
|
Atlanta
|
4 |
92 |
2 |
1 |
# |
1 |
|
Austin
|
35 |
12 |
50 |
4 |
# |
# |
|
Boston
|
15 |
45 |
29 |
10 |
# |
# |
|
Charlotte
|
40 |
46 |
9 |
4 |
# |
1 |
|
Chicago
|
11 |
46 |
39 |
4 |
# |
# |
|
Cleveland
|
15 |
75 |
9 |
# |
# |
1 |
|
District of Columbia
|
3 |
89 |
6 |
1 |
# |
# |
|
Houston
|
9 |
31 |
56 |
3 |
# |
# |
|
Los Angeles
|
10 |
11 |
72 |
7 |
# |
# |
|
New York City
|
16 |
35 |
37 |
12 |
# |
# |
|
San Diego
|
25 |
13 |
44 |
17 |
# |
# |
|
Learn more about the NAEP reporting groups on the NAEP website.
|
|
|