readingInformation About the 2005 TUDA Reading Assessment
reading: summary
reading: urban district results
reading: student group results
reading: district comparisons
reading: sample questions
mathematicsInformation About the 2005 TUDA Mathematics Assessment
mathematics: summary
mathematics: urban district results
mathematics: student group results
mathematics: district comparisons
mathematics: sample questions
information for
information for: media
information for: parents
information for: educators
information for: researchers
information for: policymakers
tuda learn more
tuda learn more: about naep
tuda learn more: about urban district
tuda learn more: downloads & tools
tuda learn more: glossary
tuda learn more: help

District Reading Results by Race/Ethnicity

At grade 4, compared to students of the same race/ethnicity in large central city schools...

  • White students in Atlanta, Austin, Charlotte, the District of Columbia, and Houston had higher average scores. White students in Cleveland had a lower average score.
  • Black students in Boston, Charlotte, Houston, and New York City had higher average scores. Black students in Chicago, the District of Columbia, and Los Angeles had lower average scores. 
  • Hispanic students in Austin, Charlotte, and New York City had higher average scores.  Hispanic students in Los Angeles had a lower average score. 
  • Asian/Pacific Islander students in New York City had a higher average score.

At grade 8, compared to students of the same race/ethnicity in large central city schools…

  • White students in Austin, Charlotte, the District of Columbia, and Houston had higher average scores.
  • Black students in the District of Columbia had a lower average score.
  • Hispanic students in Chicago had a higher average score. Hispanic students in Los Angeles had a lower average score.
  • Asian/Pacific Islander students in Boston had a higher average score.

Grade 4

Average scale scores and percentage of White students within each achievement level in reading,
grade 4 public schools: By urban district, 2005


* Average scores are significantly different from large central city public schools.
** Average scores are significantly different from nation (public schools).
NOTE: Detail may not sum to totals because of rounding. The shaded bars are graphed using unrounded numbers.
DATA: View complete data with standard errors for scale scores in districts and the nation or in large central cities, and achievement levels in districts and the nation or in large central cities.
Average scale scores and percentage of Black students within each achievement level in reading, grade 4 public schools: By urban district, 2005


# The estimate rounds to zero.
* Average scores are significantly different from large central city public schools.
** Average scores are significantly different from nation (public schools).
NOTE: Detail may not sum to totals because of rounding. The shaded bars are graphed using unrounded numbers.
DATA: View complete data with standard errors for scale scores in districts and the nation or in large central cities, and achievement levels in districts and the nation or in large central cities.

Average scale scores and percentage of Hispanic students within each achievement level in reading, grade 4 public schools: By urban district, 2005

‡ Reporting standards not met. 
* Average scores are significantly different from large central city public schools.
** Average scores are significantly different from nation (public schools).
NOTE: Detail may not sum to totals because of rounding. The shaded bars are graphed using unrounded numbers.
DATA: View complete data with standard errors for scale scores in districts and the nation or in large central cities, and achievement levels in districts and the nation or in large central cities.

Average scale scores and percentage of Asian/Pacific Islander students within each achievement level in reading, grade 4 public schools: By urban district, 2005


‡ Reporting standards not met. 
* Average scores are significantly different from large central city public schools.
** Average scores are significantly different from nation (public schools).
NOTE: Detail may not sum to totals because of rounding. The shaded bars are graphed using unrounded numbers.
DATA: View complete data with standard errors for scale scores in districts and the nation or in large central cities, and achievement levels in districts and the nation or in large central cities.

White-Black gap in average reading scores, grade 4 public schools: By urban district, various years, 2002–2005

White average score minus Black average score
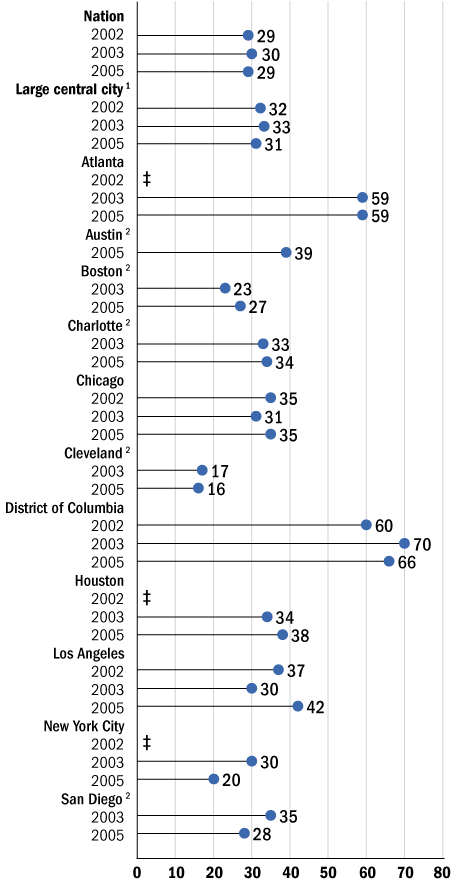
White-Black gap in average reading scores, grade 4 public schools: By urban district, various years, 2002–2005

Score gaps

‡ Reporting standards not met.
1 Some of the TUDA districts include a few public schools located outside of large central cities as defined by the Census Bureau (population of 250,000 or more within metropolitan areas). These schools are included in the category of "large central city" for all years, but were not included in previously published results. As a result, some numbers reported on this website may differ slightly from those reported earlier on the web and in print.
2 The district did not participate in 2002 or 2003.
NOTE: Score gaps are calculated based on differences between unrounded average scale scores.
DATA: View complete data with standard errors for scale scores in each district: AtlantaAustin,
BostonCharlotteChicagoClevelandDistrict of ColumbiaHoustonLos AngelesNew York City, and San Diego.

White-Hispanic gap in average reading scores, grade 4 public schools: By urban district, various years, 2002–2005

White average score minus Hispanic average score
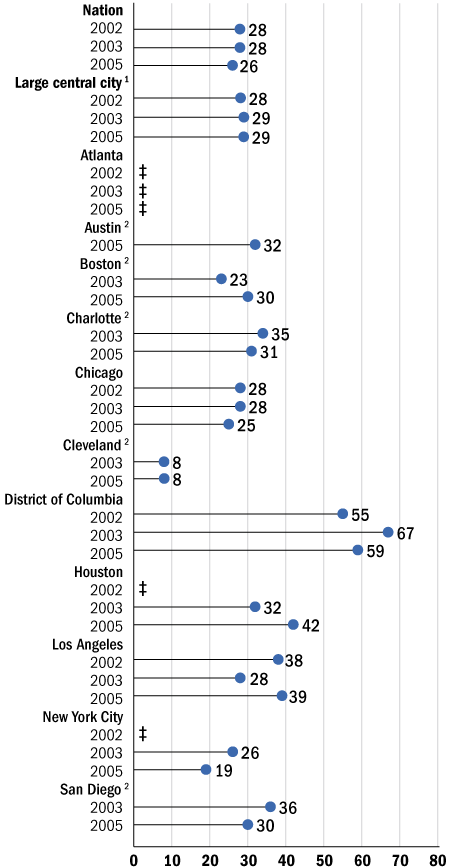
White-Hispanic gap in average reading scores, grade 4 public schools: By urban district, various years, 2002–2005

Score gaps

‡ Reporting standards not met.
1 Some of the TUDA districts include a few public schools located outside of large central cities as defined by the Census Bureau (population of 250,000 or more within metropolitan areas). These schools are included in the category of "large central city" for all years, but were not included in previously published results. As a result, some numbers reported on this website may differ slightly from those reported earlier on the web and in print.
2 The district did not participate in 2002 or 2003.
NOTE: Score gaps are calculated based on differences between unrounded average scale scores.
DATA: View complete data with standard errors for scale scores in each district: AtlantaAustin,
BostonCharlotteChicagoClevelandDistrict of ColumbiaHoustonLos AngelesNew York City, and San Diego.
Percentage of students by race/ethnicity, reading assessment, grade 4 public schools: By urban district, 2005
 
District White Black Hispanic Asian/Pacific
Islander
American Indian/
Alaska Native
Unclassified1
Nation   57 17 19 4 1 1
Large central city 21 32 38 7 1 1
Atlanta 11 85 4 1 # #
Austin 30 15 52 3 # #
Boston 12 46 32 10 # #
Charlotte 40 43 11 3 1 2
Chicago 9 48 41 3 # #
Cleveland 19 70 9 # # 1
District of Columbia 4 85 9 2 # #
Houston 12 33 51 3 # #
Los Angeles 9 10 74 7 # #
New York City 15 35 38 12 # #
San Diego 22 12 47 18 # #

Grade 8

Average scale scores and percentage of White students within each achievement level in reading, grade 8 public schools: By urban district, 2005

‡ Reporting standards not met. 
* Average scores are significantly different from large central city public schools.
** Average scores are significantly different from nation (public schools).
NOTE: Detail may not sum to totals because of rounding. The shaded bars are graphed using unrounded numbers.
DATA: View complete data with standard errors for scale scores in districts and the nation or in large central cities, and achievement levels in districts and the nation or in large central cities.
Average scale scores and percentage of Black students within each achievement level in reading, grade 8 public schools: By urban district, 2005

# The estimate rounds to zero.
* Average scores are significantly different from large central city public schools.
** Average scores are significantly different from nation (public schools).
NOTE: Detail may not sum to totals because of rounding. The shaded bars are graphed using unrounded numbers.
DATA: View complete data with standard errors for scale scores in districts and the nation or in large central cities, and achievement levels in districts and the nation or in large central cities.
Average scale scores and percentage of Hispanic students within each achievement level in reading, grade 8 public schools: By urban district, 2005

# The estimate rounds to zero.
‡ Reporting standards not met. 
* Average scores are significantly different from large central city public schools.
** Average scores are significantly different from nation (public schools).
NOTE: Detail may not sum to totals because of rounding. The shaded bars are graphed using unrounded numbers.
DATA: View complete data with standard errors for scale scores in districts and the nation or in large central cities, and achievement levels in districts and the nation or in large central cities.
Average scale scores and percentage of Asian/Pacific Islander students within each achievement level in reading, grade 8 public schools: By urban district, 2005

‡ Reporting standards not met. 
* Average scores are significantly different from large central city public schools.
** Average scores are significantly different from nation (public schools).
NOTE: Detail may not sum to totals because of rounding. The shaded bars are graphed using unrounded numbers.
DATA: View complete data with standard errors for scale scores in districts and the nation or in large central cities, and achievement levels in districts and the nation or in large central cities.
White-Black gap in average reading scores, grade 8 public schools: By urban district, various years, 2002–2005

White average score minus Black average score
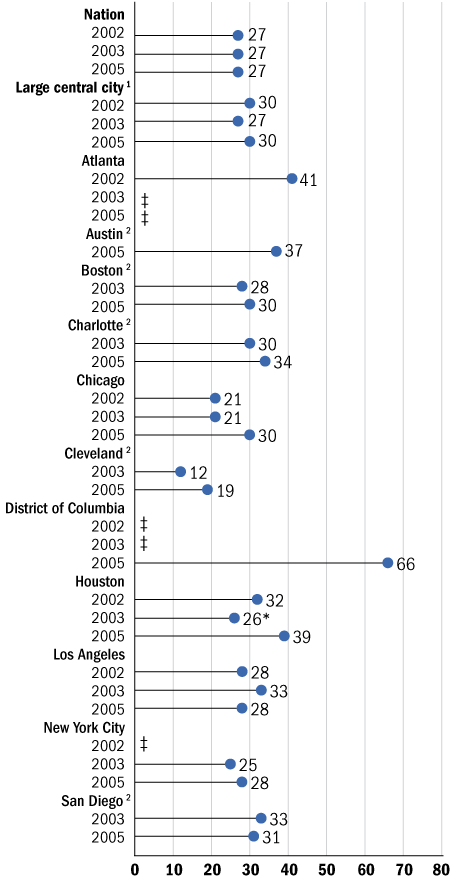
White-Black gap in average reading scores, grade 8 public schools: By urban district, various years, 2002–2005  

Score gaps

‡ Reporting standards not met.
* Score gap is significantly different from 2005.
1 Some of the TUDA districts include a few public schools located outside of large central cities as defined by the Census Bureau (population of 250,000 or more within metropolitan areas). These schools are included in the category of "large central city" for all years, but were not included in previously published results. As a result, some numbers reported on this website may differ slightly from those reported earlier on the web and in print.
2 The district did not participate in 2002 or 2003.
NOTE: Score gaps are calculated based on differences between unrounded average scale scores.
DATA: View complete data with standard errors for scale scores in each district: AtlantaAustin,
BostonCharlotteChicagoClevelandDistrict of ColumbiaHoustonLos AngelesNew York City,
and San Diego.
White-Hispanic gap in average reading scores, grade 8 public schools: By urban district, various years, 2002–2005

White average score minus Hispanic average score
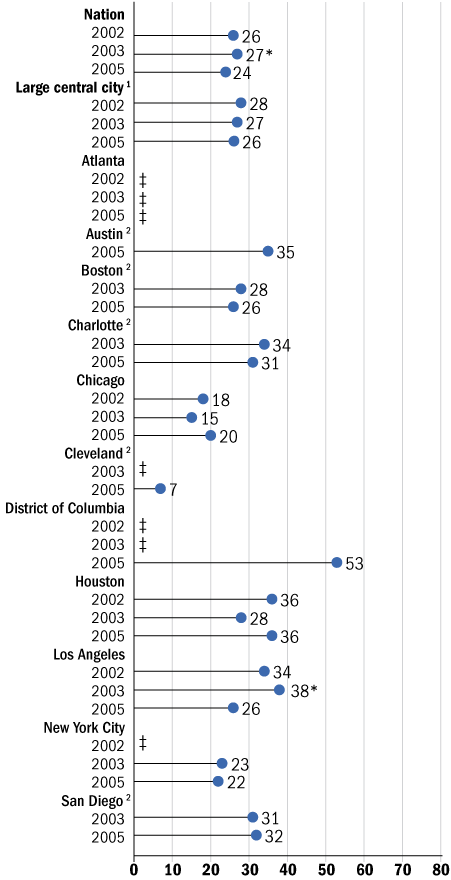
White-Hispanic gap in average reading scores, grade 8 public schools: By urban district, various years, 2002–2005


Score gaps

‡ Reporting standards not met.
* Score gap is significantly different from 2005.
1 Some of the TUDA districts include a few public schools located outside of large central cities as defined by the Census Bureau (population of 250,000 or more within metropolitan areas). These schools are included in the category of "large central city" for all years, but were not included in previously published results. As a result, some numbers reported on this website may differ slightly from those reported earlier on the web and in print.
2 The district did not participate in 2002 or 2003.
NOTE: Score gaps are calculated based on differences between unrounded average scale scores.
DATA: View complete data with standard errors for scale scores in each district: AtlantaAustin,
BostonCharlotteChicagoClevelandDistrict of ColumbiaHoustonLos AngelesNew York City, and San Diego.

Percentage of students by race/ethnicity, reading assessment, grade 8 public schools: By urban district, 2005
District White Black Hispanic Asian/Pacific
Islander
American Indian/
Alaska Native
Unclassified1
Nation 60 17 17 4 1 1
Large central city   24 32 36 7 1 #
Atlanta 4 92 2 1 # 1
Austin 35 12 50 4 # #
Boston 15 45 29 10 # #
Charlotte 40 46 9 4 # 1
Chicago 11 46 39 4 # #
Cleveland 15 75 9 # # 1
District of Columbia 3 89 6 1 # #
Houston 9 31 56 3 # #
Los Angeles 10 11 72 7 # #
New York City 16 35 37 12 # #
San Diego 25 13 44 17 # #

Learn more about the NAEP reporting groups on the NAEP website.

View State SnapshotView TUDA Snapshot:

Download and Print

Download Reading Report