Average Science Scores in 2005 Higher at Grade 4, Unchanged at Grade 8, and Lower at Grade 12 Since 1996
- At grade 4, the average science score was higher in 2005 than in previous assessment years.
- At grade 8, the average science score in 2005 showed no significant change compared to results in 1996 and 2000.
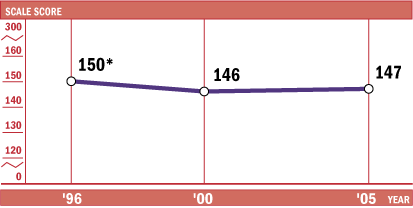
- At grade 12, the average science score was lower than in 1996, and showed no significant change from 2000.
|
Trend in twelfth-grade average NAEP science scores

* Significantly different from 2005.
NOTE: View complete data with standard errors for grade 12.
SOURCE: U.S. Department of Education, Institute of Education Sciences, National Center for Education Statistics, National Assessment of Educational Progress (NAEP), 1996, 2000, and 2005 Science Assessments.
|
|
|
NAEP science scores are reported on a separate 0–300 scale for each of the three grades assessed. Beginning in 1996 at the national level, and in 2000 at the state level, administration procedures were introduced that allowed the use of accommodations for students who needed them. In addition to allowing for accommodations, the 1996 and 2000 national results at grades 4 and 8 may differ slightly from those previously reported due to changes in the sample weighting procedures. Read more about the 2005 science assessment on the NAEP website. Read how the assessment was developed, what it measures, and how it was administered.
|