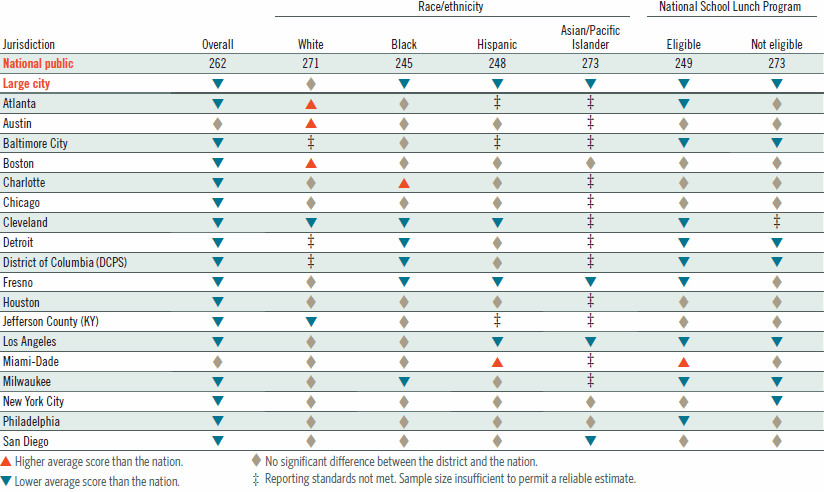
 Even though most TUDA districts performed below the national average overall, scores for student groups in some districts were higher than the scores for their peers in the nation.
- Among the 16 districts where overall average scores were lower than the national average, scores were higher for White students in Atlanta and Boston and for Black students in Charlotte.
- Only Cleveland showed lower scores for all categories of students by race/ethnicity and eligibility for the National School Lunch Program with samples large enough to report results.
Comparison of district and national average scores for eighth-grade public school students in NAEP reading, by selected student groups: 2009

NOTE: Black includes African American, Hispanic includes Latino, and Pacific Islander includes Native Hawaiian. Race categories exclude Hispanic origin. The NAEP Reading scale ranges from 0 to 500. DCPS = District of Columbia Public Schools.
SOURCE: U.S. Department of Education, Institute of Education Sciences, National Center for Education Statistics, National Assessment of Educational Progress (NAEP), 2009 Reading Assessment.