Skip navigation

The Nation's Report Card


Long-Term Trend Overall Results Student Groups Contextual Variables Sample Questions Math Sample Questions Reading Sample Questions Test Yourself About the Assessment Information For… Media Parents Educators Researchers Policymakers Resources About the Nation's Report Card Data Tools FAQ Contacts


Mathematics Sample QuestionsTest yourself and see how students responded to the same questions on NAEP.

Three sample mathematics questions are presented in this section for each age. The response options for multiple-choice questions are provided as the students saw them, and the oval for the correct answer is filled in. All constructed-response questions in the long-term trend mathematics assessment were scored as correct or
incorrect, and the correct response is shown on the answer line.

Age 9
 Age 13
 Age 17

Sample question 3 asked students to read a scale on a number line presented in the context of a bicycle speedometer. To answer the question, the student had to determine the value corresponding to a point halfway between the points marked at 10 and 20 miles per hour. 

 85 percent of 9-year-olds answered this question correctly.


Image of speedometer showing miles per hour

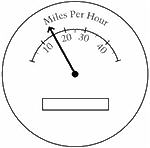
The bicycle speedometer above shows about what speed?

 A

10 miles per hour

 B

15 miles per hour

 C

20 miles per hour 

 D

45 miles per hour 


The correct answer is B.

See more about this question in the NAEP Questions Tool.

2008 Long-Term Trend Report Card 2008 Long-Term Trend Report Card