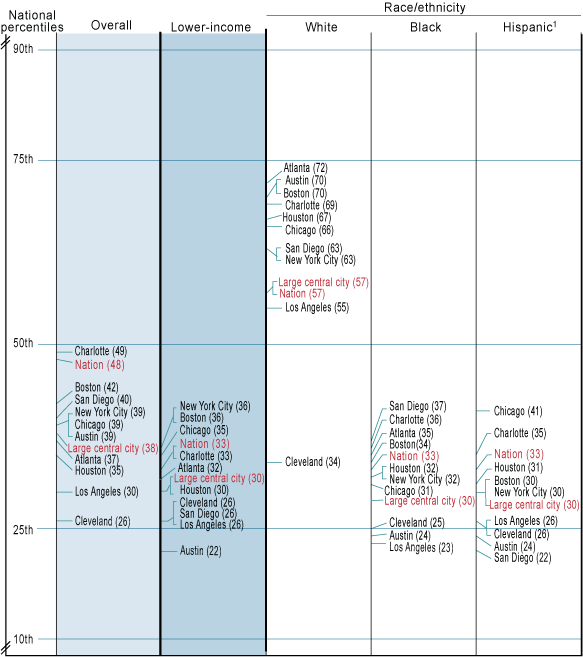
District percentile rankings varied by demographic groups
The figure below shows how groups of students within each participating urban district compared with the NAEP national public school percentiles. The average score for the group was used to determine its percentile rank compared with all students in public schools nationally. The scores for the nation and large central cities are also plotted. For example, the average score for eighth-grade Hispanic students in Chicago was at the 41st percentile. This means that, on average, they performed as well as or better than 41 percent of students nationwide. In comparison, the average score for Hispanic students in large central cities was at the 30th percentile.
National percentile rankings for urban districts based on average scores for eighth-grade public school students in NAEP writing, by lower-income status and selected race/ethnicity categories: 2007

1 Sample size was insufficient to permit a reliable estimate for Hispanic students in Atlanta.
NOTE: Groups not shown are included in overall. In NAEP, students from lower-income families are identified as eligible for the National School Lunch Program. Black includes African American, and Hispanic includes Latino. Race categories exclude Hispanic origin. The 50th percentile represents the middle score in the distribution of scores for public school students nationally. The average score for these students, however, fell below that point at the 48th percentile because there was a greater concentration of scores toward the lower end of the scale compared to the higher end. View the complete data.
SOURCE: U.S. Department of Education, Institute of Education Sciences, National Center for Education Statistics, National Assessment of Educational Progress (NAEP), 2007 Trial Urban District Writing Assessment.