National Data Explorer Tool Help
Have a question? Contact us at Contact NAEP
THE NAEP DATA EXPLORER
The NAEP Data Explorer (NDE) is a web-based application for accessing National Assessment of Educational Progress (NAEP) data. NAEP has been tracking student learning nationwide since 1969, and conducting state-level assessments since 1990 and assessments in selected districts since 2002. NAEP assesses what the nation's students know and can do in a variety of subjects.
NAEP does not provide scores for individual students or schools; instead, it offers results for populations of students (e.g., fourth-graders) and subgroups of those populations (e.g., female students, Hispanic students) as well as results regarding subject-matter achievement, instructional experiences, and school environment. NAEP results are based on school and student samples that are carefully designed to accurately represent student populations of interest.
MAIN NDE
Main NDE houses the databases for the bulk of the NAEP assessments, including subjects such as civics, economics, geography, mathematics, music, reading, science, technology and engineering literacy, U.S. history, visual arts, vocabulary, and writing. Main NAEP assessments follow the frameworks developed by the National Assessment Governing Board, and use the latest advances in assessment methodology.
For many of the subjects shown above, national results have been reported over the years for grades 4, 8, and 12—although not all grades are assessed each time. Four of these subjects (mathematics, reading, science, and writing) are also reported at the state level, and may be reported for selected urban districts. National results include public and private schools, but at the state or district level, results are for public schools only.
State assessments began in 1990. The Trial Urban District Assessment (TUDA) in selected urban districts began in conjunction with the state NAEP reading and writing assessments in 2002. Data from the Puerto Rico mathematics assessments for several years are also available in NDE.
LONG-TERM TREND NDE
The Long-Term Trend (LTT) NDE permits access to data gathered from students and reported in the LTT assessments in mathematics since 1978 and in reading since 1971. Since the students are selected to represent the nation, there are national results, but none at the state level. Note that these data are from distinctly different assessments from those used in main NAEP. The data are in no way comparable to those for main NAEP.
HIGH SCHOOL TRANSCRIPT STUDY NDE
The High School Transcript Study (HSTS) is designed to inform the public about the coursetaking patterns of high school graduates. The HSTS analyzes transcripts collected from a nationally-representative sample of twelfth-graders in public and private schools. Studies were conducted in 1990, 1994, 1998, 2000, 2005, and most recently in 2009. Over 20,000 transcripts have been collected each study year with over 37,000 transcripts in 2009. The study also explores the relationship between coursetaking patterns and student achievement for those graduates who had participated in NAEP.
Based on graduate participation in NAEP, there are two sets of data available for analysis with the NDE for the HSTS. The first allows the users to analyze transcript data for all graduates in the NAEP sample, whether they had participated in NAEP or not. These data are accessible by selecting Transcript as the subject in Step 1.
The second set of data is limited to graduates who have participated in a NAEP assessment. For the HSTS in 2000, 2005, and 2009, the NAEP assessments in the HSTS included mathematics and science assessments; select either subject in Step 1. By linking the NAEP data to the transcript data, the relationship between coursetaking patterns and NAEP student questionnaire data as well as NAEP performance can be analyzed. The NDE analyses are for NAEP students who were sampled in either NAEP subject, and who graduated by the fall of the assessment year. Note that for main NAEP, the results are from students who were in grade 12 during the testing period (January to March) whether they graduated or not.
NATIONAL INDIAN EDUCATION STUDY NDE
The National Indian Education Study (NIES) is a two-part study designed to describe the condition of education for American Indian and Alaska Native (AI/AN) students in the United States. Conducted in 2005, 2007, 2009, 2011, and 2015, NIES provides data for a nationally representative sample of American Indian and Alaska Native students who attend public, private, Department of Defense, and Bureau of Indian Education (BIE) funded schools. It is a reliable source of data on American Indian and Alaska Native students, especially for educators, administrators, and policymakers who address the educational needs of students.
NIES Part I (Assessment): NAEP Mathematics and Reading Results
Part I of the NIES provides in-depth information on the mathematics and reading performance of 4th- and 8th-grade American Indian and Alaska Native students. These data come from the NAEP assessment and are presented either as overall totals or in the context of information from NAEP student, teacher, and school questionnaires.
To explore Part I data, select either Mathematics or Reading and one grade, and you will be presented with the same statistics options used in NDE for main NAEP. The NIES Part I results can also be explored in the context of the NIES survey (Part II) questions.
NIES Part II (Survey): NIES Survey Results
Part II of the study provides information on the extent of American Indian and Alaska Native students’ experience with their culture and language related to education. NIES Part II collects such information with a separate survey questionnaire; the participants include the students and their teachers and school administrators. The NIES survey is administered to American Indian/Alaska Native students after the regular NAEP assessment.
To explore Part II data, select NIES Survey and one grade. Note that here, data are provided only for the percentages of responses to each survey question administered from 2007 forward. No 2005 survey data are included because there were differences in the design and administration procedures of the study that precludes comparison of the 2005 survey with the survey of the later years. For 2005 survey results, see the report National Indian Education Study: Part II.
NIES regions are defined differently from NAEP regions, although both are derived from U.S. Census divisions or aggregations of Census divisions. NIES regions are configured to align with the overall distribution of the American Indian/Alaska Native student population.
COMPUTER REQUIREMENTS FOR NDE
The NDE is best viewed at screen resolution 1024w and above.
Here are the operating systems and browsers supported for PC and tablets:
| Windows 7, 8.1 | Chrome | Latest version | PC |
| Windows 7, 8.1 | Internet Explorer | 10, 11 | PC |
| Windows 7, 8.1 | Firefox | Latest version | PC |
| Osx | Safari | Latest version | Mac |
| Osx | Chrome | Latest version | Mac |
| iOS | Safari | Latest version | iPad |
| iOS | Chrome | Latest version | iPad |
| Android | Chrome | Latest version | Galaxy (tablet) |
| Windows 10 | Internet Explorer | Latest version | Surface (tablet) |
| Windows 10 | Chrome | Latest version | Surface (tablet) |
| Windows 10 | Firefox | Latest version | Surface (tablet) |
| Windows 10 | Edge | Latest version | Surface (tablet) |
- Enable JavaScript and pop-ups in your browser.
- Exports of files to Microsoft Office require Office 2003 or later.
- Exports of files to PDF can be read with Adobe Acrobat Reader.
- Screen reader software should be Jaws 14.0 or higher.
NOTE: If you encounter an error, please send us the details through Contact Us. When writing, include information about your operating system and browser, and as many other details as possible. Be sure to provide an email address so that we can contact you.
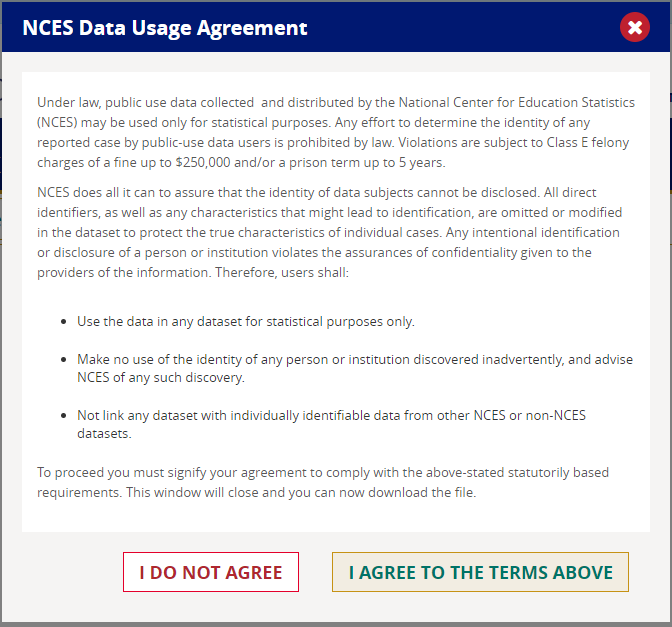
NCES DATA USAGE AGREEMENT
In order to be able to enter the NAEP Data Explorer, it is necessary to review and agree to the terms of the NCES Data Usage Agreement. After you click on the button agreeing to the terms, you will be taken to the Data Explorer. If you do not do this, you will be redirected to the home page for The Nation’s Report Card’s Data Tools.
USING THE NDE
THE LANDING PAGE
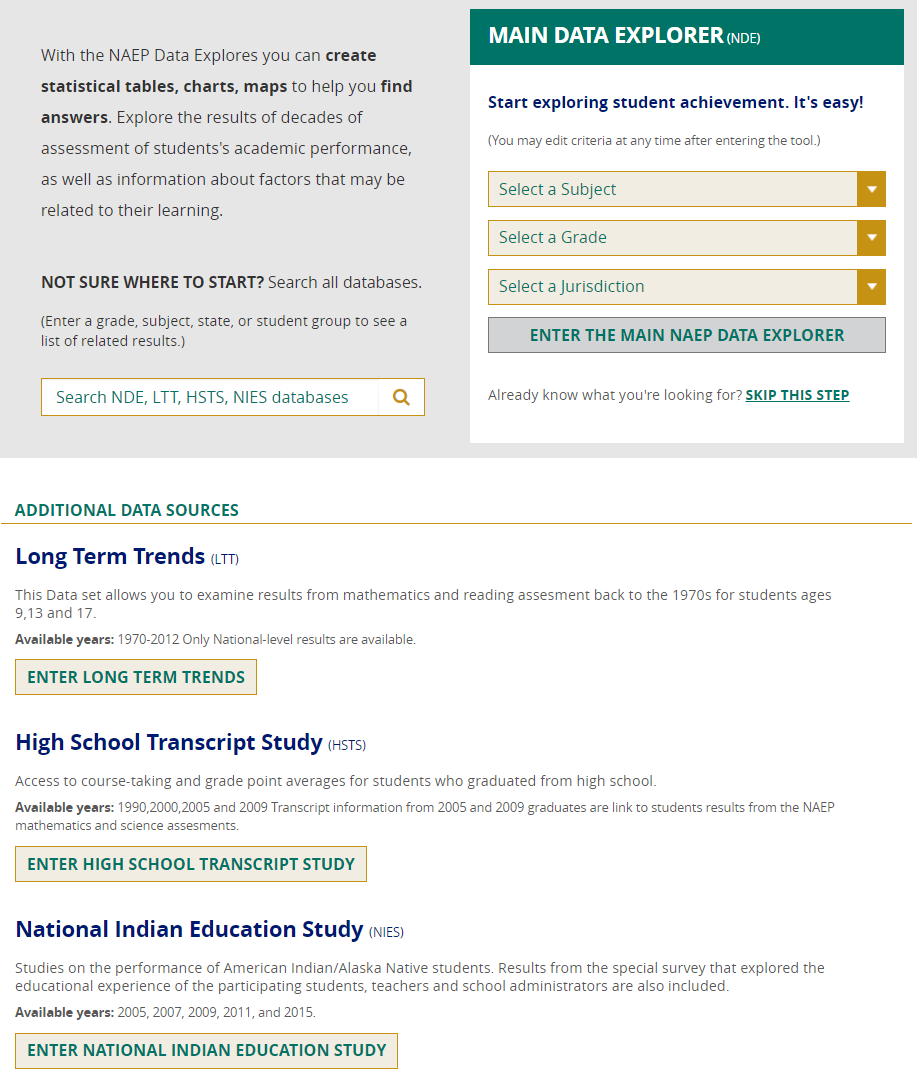
There are two ways to start exploring Main NAEP data from the Landing Page of the NAEP Data Explorer (NDE):
- If you already know the subject, grade, and jurisdiction you are interested in, you may select them using the drop-down menus on this screen and then click on the GO button.
- Alternatively, by clicking on the ENTER THE MAIN NAEP DATA EXPLORER button, you will be able to choose all criteria after you have entered the tool.
The Landing Page also provides links to databases for the Long-Term Trend Assessments, the High School Transcript Study, and the National Indian Education Study. Because the functionality is the same for all of the databases, only Main NAEP is used in this Help documentation to illustrate how NDE works.
SELECTING CRITERIA
There are four main categories of criteria to choose from on this initial view page of the Data Explorer:
- Subject/Grade/Year/Scale
- Jurisdiction
- Variable
- Statistic
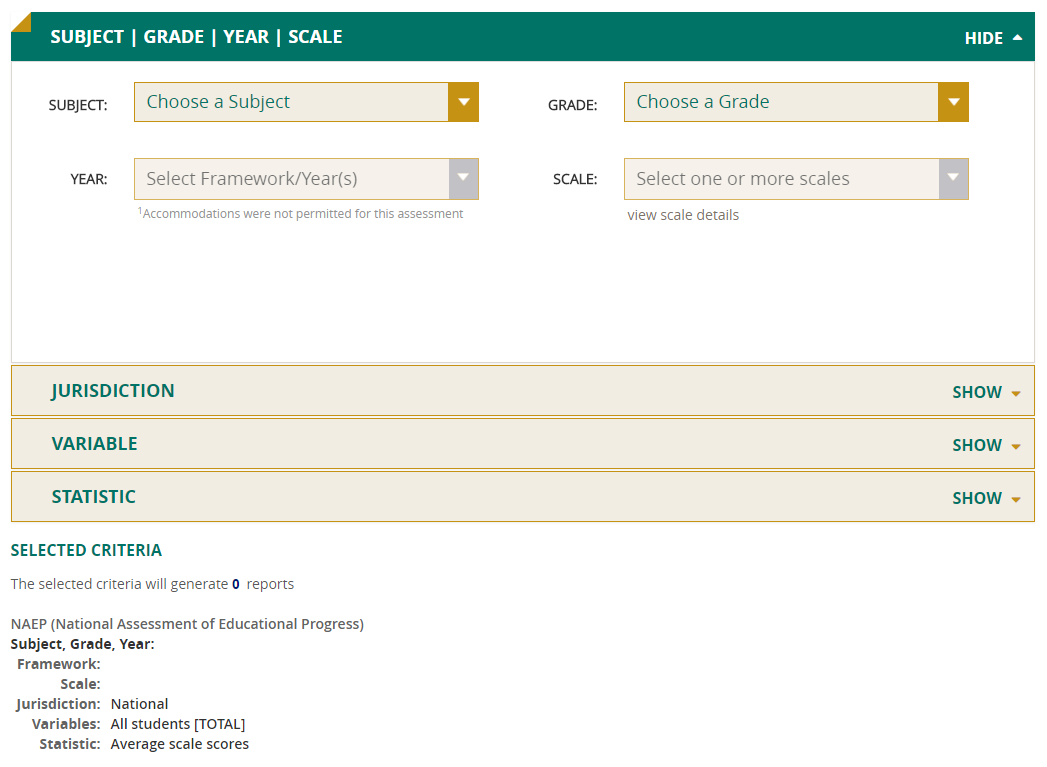
If you have entered the Data Explorer without having specified any criteria on the Landing Page, then the subject, grade, year, and scale will need to be selected at this time. However, other default criteria will have been filled in for you, including the jurisdiction (national), the variable (all students), and the statistic (average scale scores). To make changes to any of these, click on the category to display the range of options.
If, on the other hand, you specified the subject, grade, and jurisdiction while on the Landing Page, then these selections will already have been populated for you on this initial view page, along with the most recent year for that subject’s assessment.
If you do not wish to change the default criteria of the variable (all students) and the statistic (average scale scores) that have also been filled in, you can click on one of the Create Report buttons to generate your output immediately.
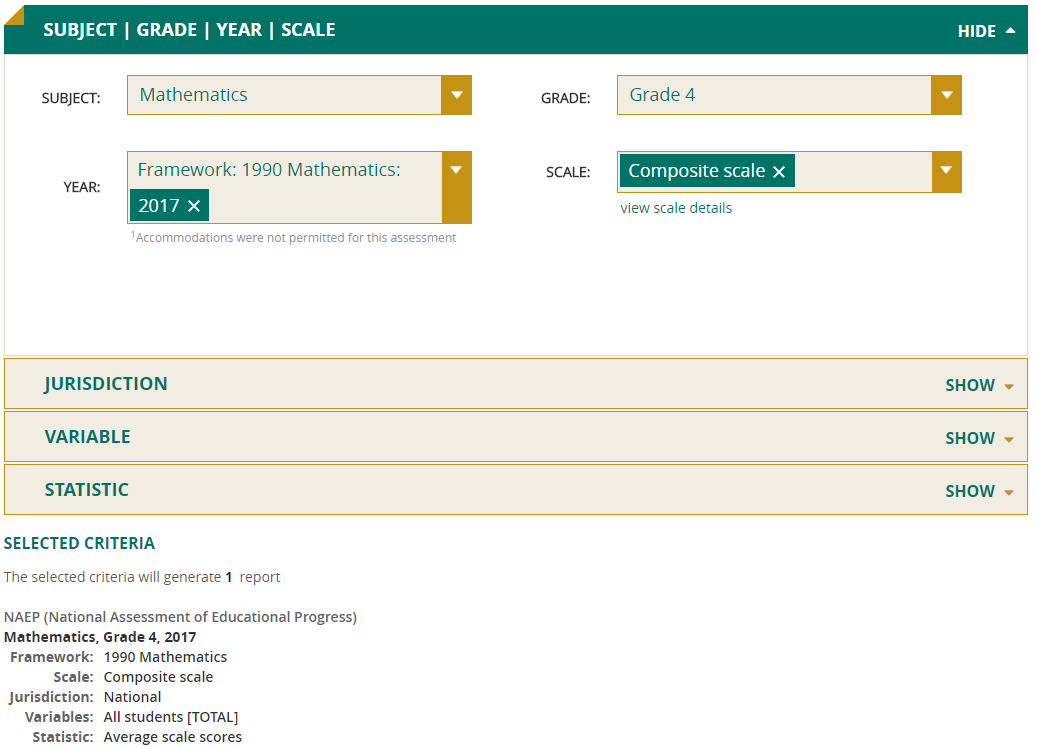
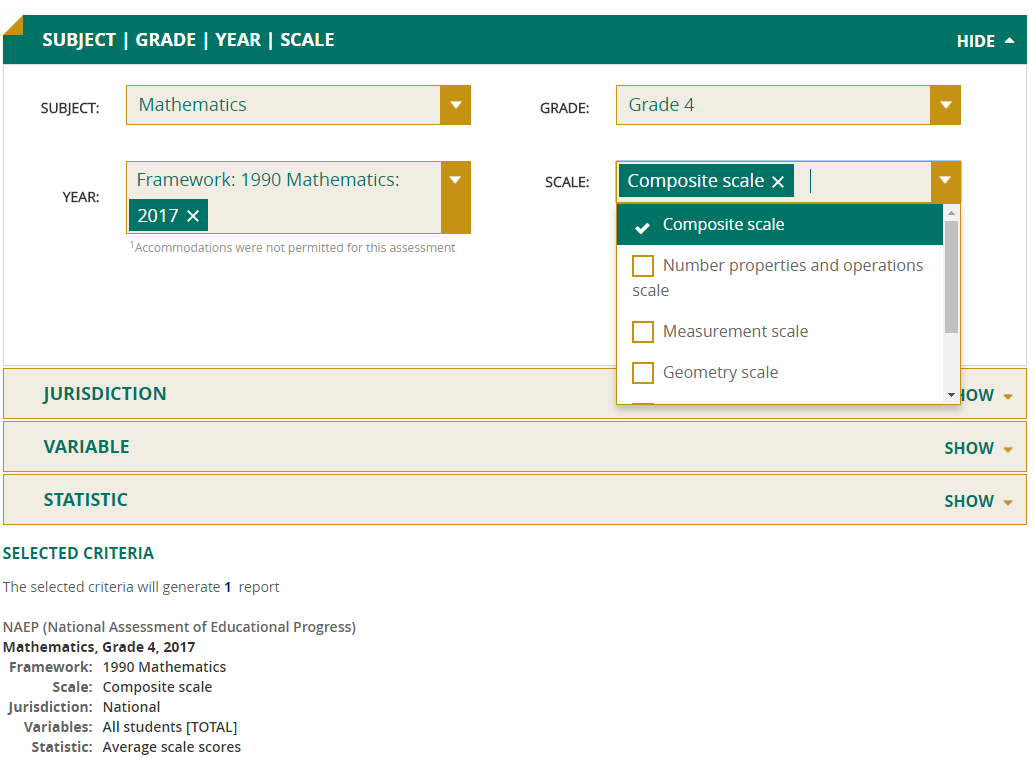
Subject/Grade/Year/Scale
Your data query in the NDE begins with the Subject/Grade/Year/Scale criteria, where you can start by using the drop-down menus to select a subject and a grade.
The screen will refresh to show the most recent assessment year and its associated framework (a document that guides the development of an assessment and determines the content to be assessed). Select all the years that are of interest to you. You will need to deselect the default most recent year if you are not interested in that data.
If you wish to view a different grade than you originally selected, it may no longer appear in the grade drop-down menu if it is guided by a different framework (for example, grade 12 mathematics is not a choice after selecting grade 4 mathematics because a new framework was used for grade 12 beginning in 2005). In that case, click on the X next to the year, and the year and framework selections will be cleared and all grades will once again be available for selection.
Composite scale will appear as the default selection for scale. The composite scale is the overall measure of the subject assessed, while subscales are constituent parts of the composite subject scale for an assessment. For example, grade 4 mathematics includes five subscales: number properties and operations; measurement; geometry; data analysis, statistics, and probability; and algebra. If you need results for one or more subscales of a subject, note that there are not as many data for them because there will be proportionally fewer student responses.
Jurisdiction
Select the jurisdictions you are interested in from the categories National, State, District, Territory/Other, and Region. Available jurisdictions will vary depending on the assessment you have chosen.
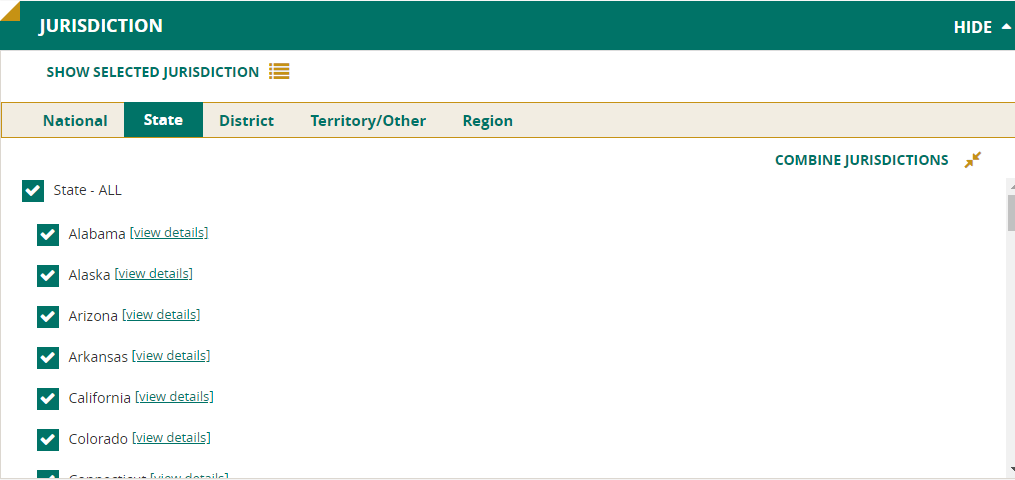
Combine Jurisdictions
If you have selected several states or districts, it may be helpful to combine jurisdictions into a new one. (For some NAEP databases, there is only one jurisdiction—national—so you will not be able to create new jurisdictions.)
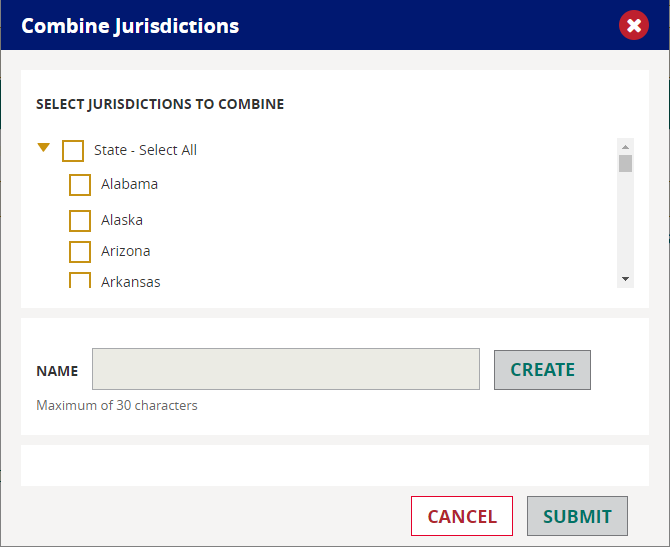
Jurisdictions can only be combined within the particular categories. For example, several states could be combined to form a new jurisdiction, but states may not be combined with districts to create a new jurisdiction. Additionally, within the region category, Census regions cannot be combined with NAEP regions.
To proceed, first select the jurisdictions you want to combine, and then click on the Combine Jurisdictions button. Select the individual jurisdictions again as prompted, give the new combined jurisdiction a name, and click Create. Repeat these steps to create more new jurisdictions. When you are finished, press Submit.
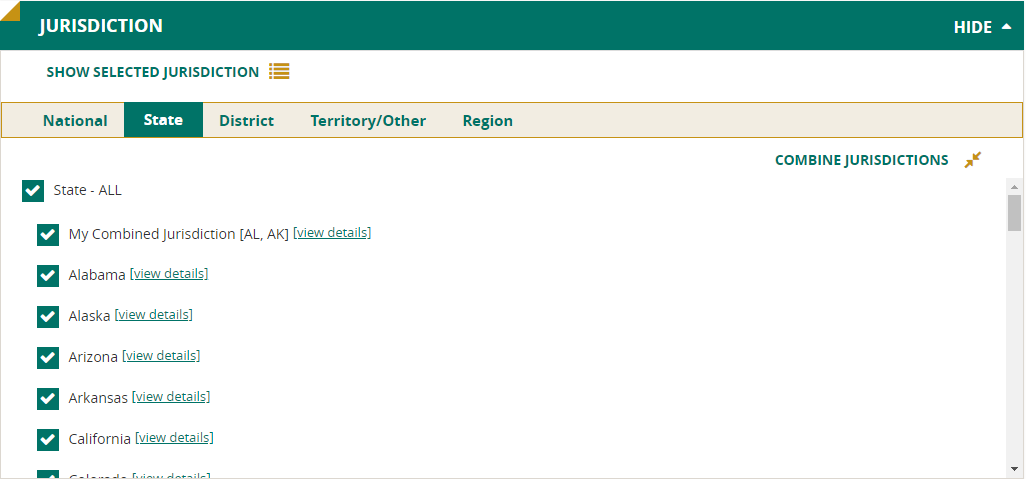
The newly created jurisdiction(s) will appear at the top of the original list of jurisdictions, and will display the name you gave it as well as list the component jurisdictions in parentheses. You may want to deselect the original jurisdictions and select those that you just created.
NOTE: Any new jurisdictions you create will be available for subsequent reports.
Variable
Select the variables you are interested in by using the Select a Category and Select a Subcategory drop-downs to help narrow your search.
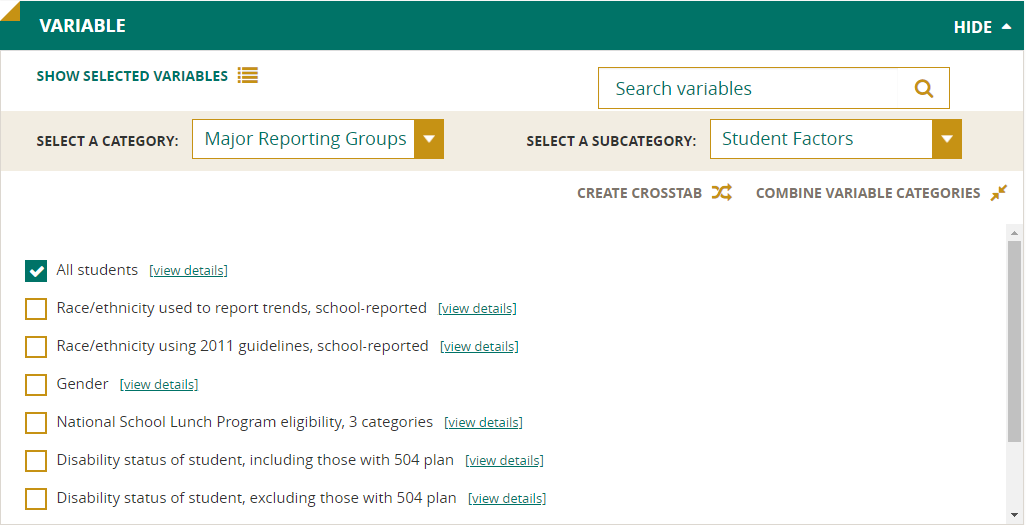
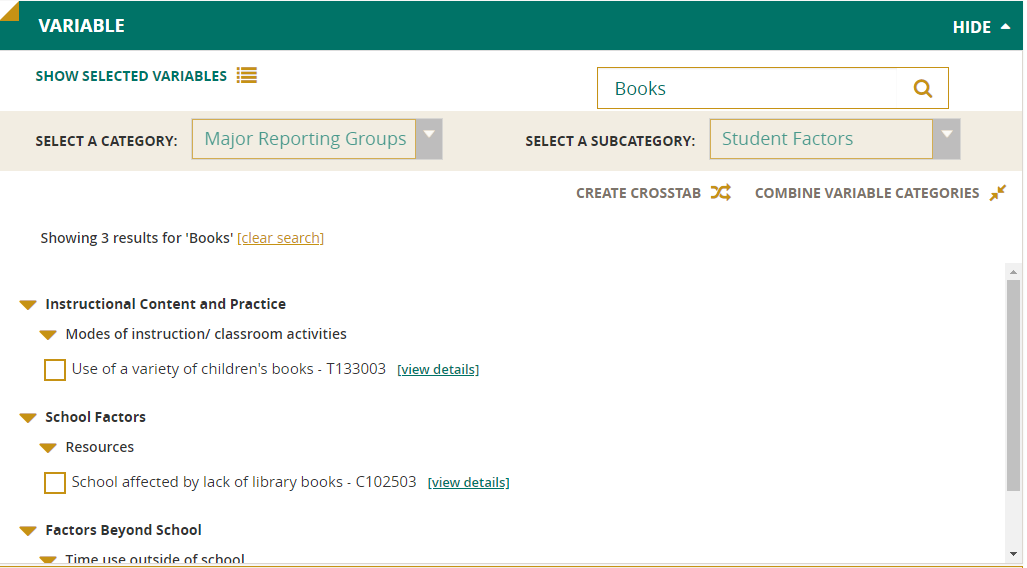
Alternatively, use the Search Variables feature to type in some keywords to search. The Select a Category, Create Crosstabs, and Combine Variable Categories boxes will be disabled when you type in the Search box. Clicking Clear Search will remove the search results and return you to the previously viewed categories.
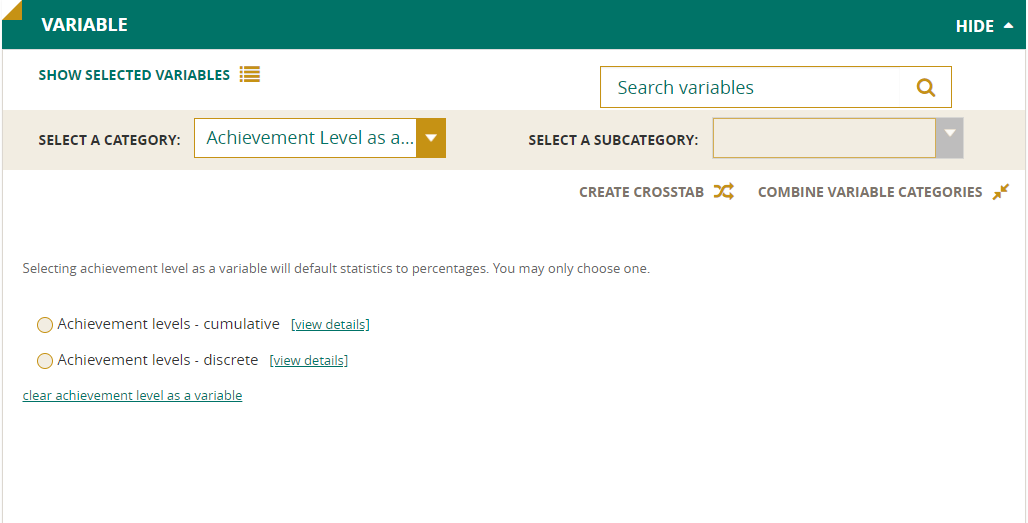
Achievement Level as a Variable
NDE permits the statistic “achievement levels” to be selected as a variable. Using achievement levels as a variable allows you to answer the question, “Of those students who score at a given level, what percentage of the sample falls into each of the categories of the background variable?” For example, of those students who are performing at the NAEP Proficient level, what percentage are female? See the Achievement Levels as Independent Variables (Technical) section of this Help documentation for more information.
To utilize this feature, select Achievement Level as a Variable from the Select a Category drop-down and choose either discrete or cumulative achievement levels. Next, select the background variable of interest (e.g., gender) and generate your report.
NOTE: You will not be able to edit table layout when a statistic is a variable.

Combine Variable Categories
You may wish to use the Combine Variable Categories feature to eliminate or combine some of the component values of a variable.
To get started, select the variable for which you wish to combine values and click on the Combine Variable Categories button. Select the desired values as prompted, give the new value a name, and click Create.
Repeat these steps to create more new values, and then click Submit.
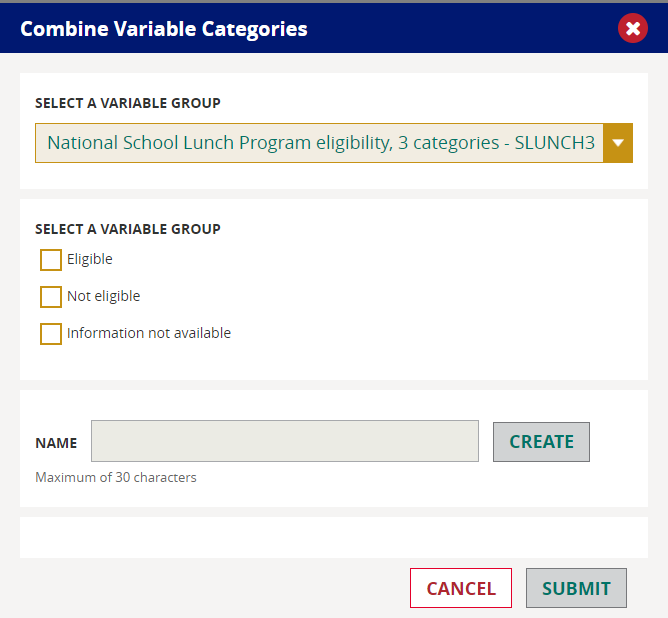
The new variable will appear at the bottom of the variables list, with the designation “combined” to differentiate it from the original variable.
NOTE: Any new variable values you create will be available for subsequent reports.
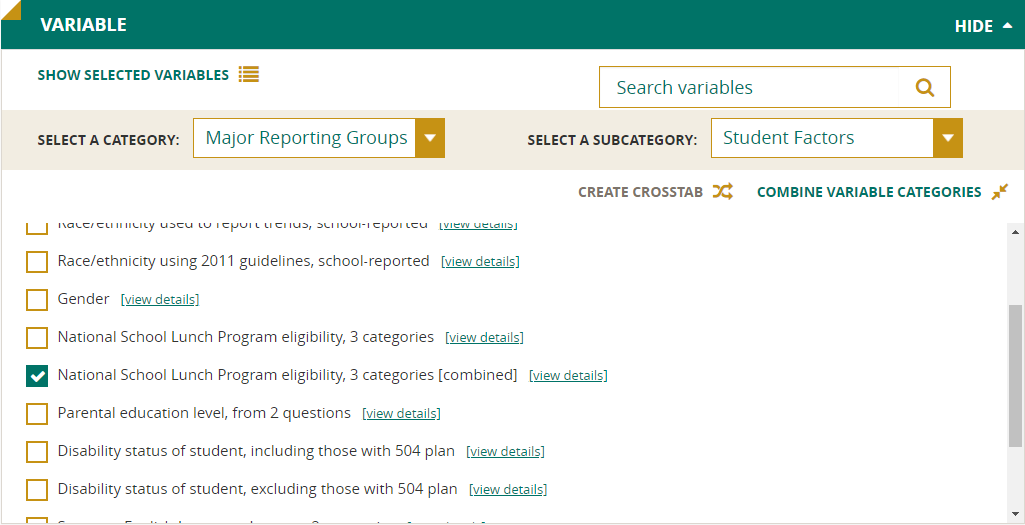
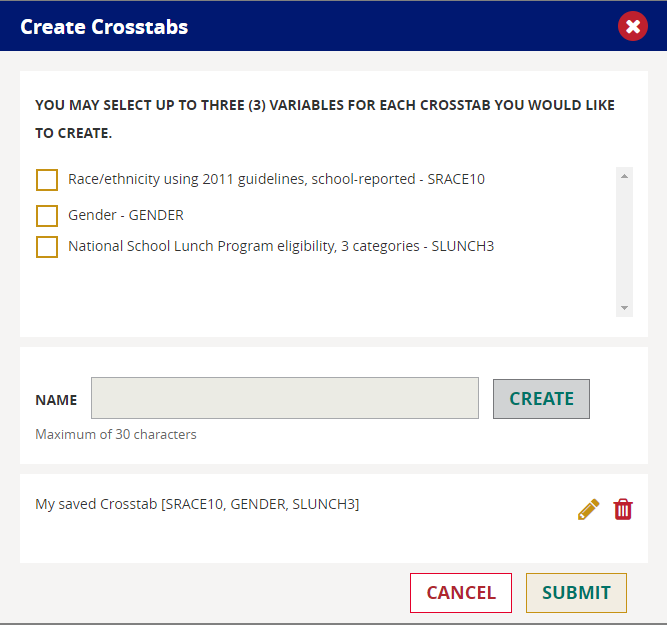
Create Crosstabs
Another feature in the Variable section is the Create Crosstabs button which allows you to combine separate variables into a single table. Otherwise, each variable would have its own separate table.
Start by selecting either two or three variables for each crosstab you would like to create and click on Create Crosstabs. Select the variables as prompted, create a name for the crosstab, and click Create and then Submit.
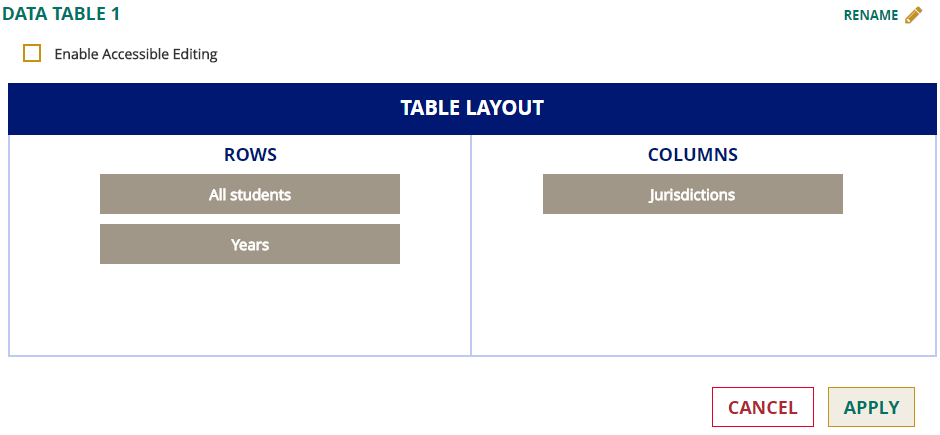
After you have created your report, you may wish to modify the output.
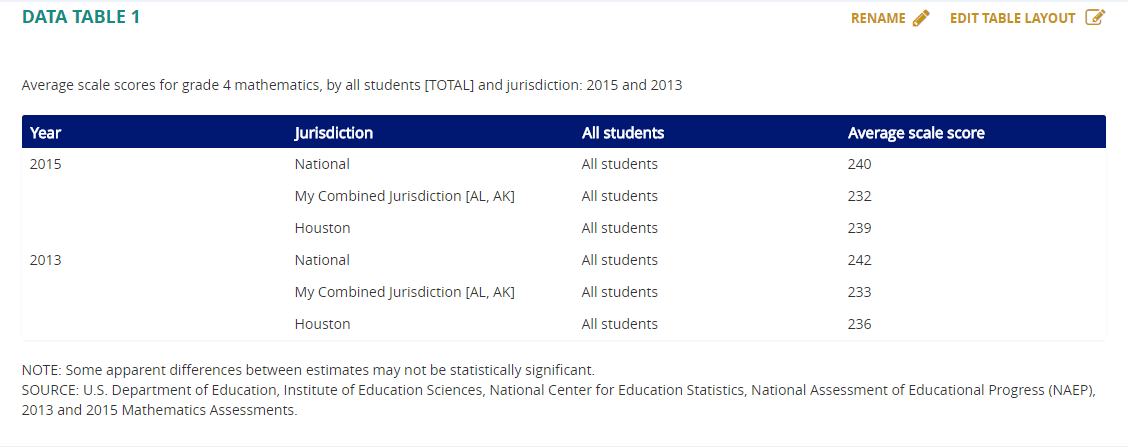
Click on Edit Table Layout and move the displayed variables from the Rows or Columns sections as desired, then click Apply and the output will appear in the new format.
Statistic
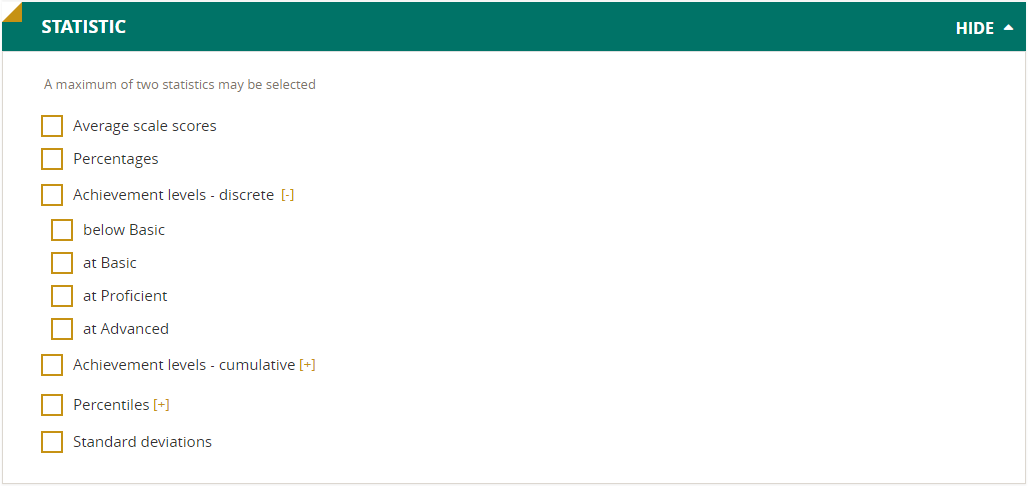
The Statistic options allow you to designate a maximum of two statistics for your report (the other options will be grayed out after you have selected two options). Here are the statistics available:
- Average Scale Scores. For the Main NAEP assessments, student performance is reported on NAEP scales that range from 0–300 (for most subjects) or 0–500.
- Percentages. Percentages indicate the proportion of students represented in the table cell. For example, if the row percentage for Black female students is 22 percent, then Black female students represent 22 percent of the student population in the selected jurisdiction.
- Achievement Levels (Cumulative). For most Main NAEP assessments, the National Assessment Governing Board has set achievement levels—standards for what students should know and be able to do in each subject. For each assessment, NAEP reports the percentages of students performing at or above these standards (that is, at or above Basic and at or above Proficient include students at all higher levels). The percentages are reported as below Basic, at or above Basic, at or above Proficient, and at Advanced.
- Achievement Levels (Discrete). Discrete levels are reported as percentages of students performing at each level, counted separately from the other levels: below Basic, at Basic, at Proficient, and at Advanced.
- Percentiles. Percentile data show the scale score attained by students performing at higher, middle, and lower ranges of the distribution. In NAEP, the percentile is defined by the percentage of students scoring lower than a particular scale score. For example, if the 25th percentile is 132, it means that 25 percent of the students scored below 132. Percentile changes over time help indicate trends in how students perform at higher and lower levels. Scale score performance data are available for student groups at the 10th, 25th, 50th, 75th, and 90th percentiles.
- Standard Deviations. Standard deviations represent a measure of how widely or narrowly scores are dispersed for a particular data set. Under general normality assumptions, 95% of the scores are within 2 standard deviations of the mean. For example, if the average score of a data set is 150 and the standard deviation is 35 it means that 95% of the scores in this data set fall between 80 and 220. The definition of the variance is the average squared difference of each observation and the average. The standard deviation is the square root of the variance.
NOTE: Not all statistics are available for all reports. Availability depends on other selections you have made to define the content and format of your report.
CREATING REPORTS
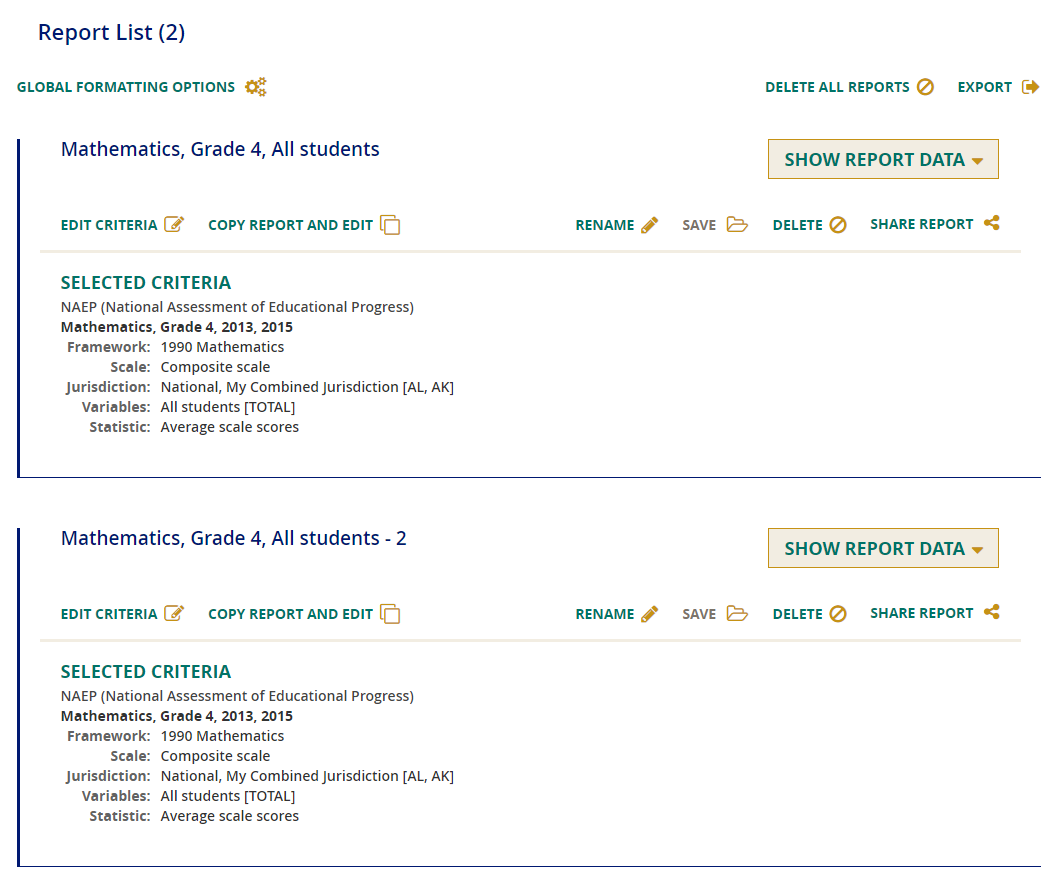
List
Before you retrieve the desired report data, you will have the opportunity to review your selections and, if necessary, make changes to the designated criteria.
After selecting the Subject/Grade/Year/Scale, Jurisdiction, Variable, and Statistic, click on Create Report. Here you will be able to Edit Criteria or Copy Report and Edit, if you wish to make changes to any of the aforementioned categories. Otherwise, click on Show Report Data to generate results.
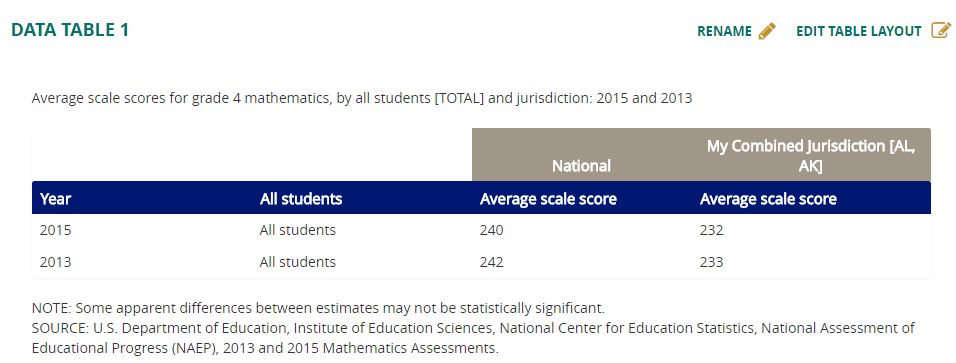
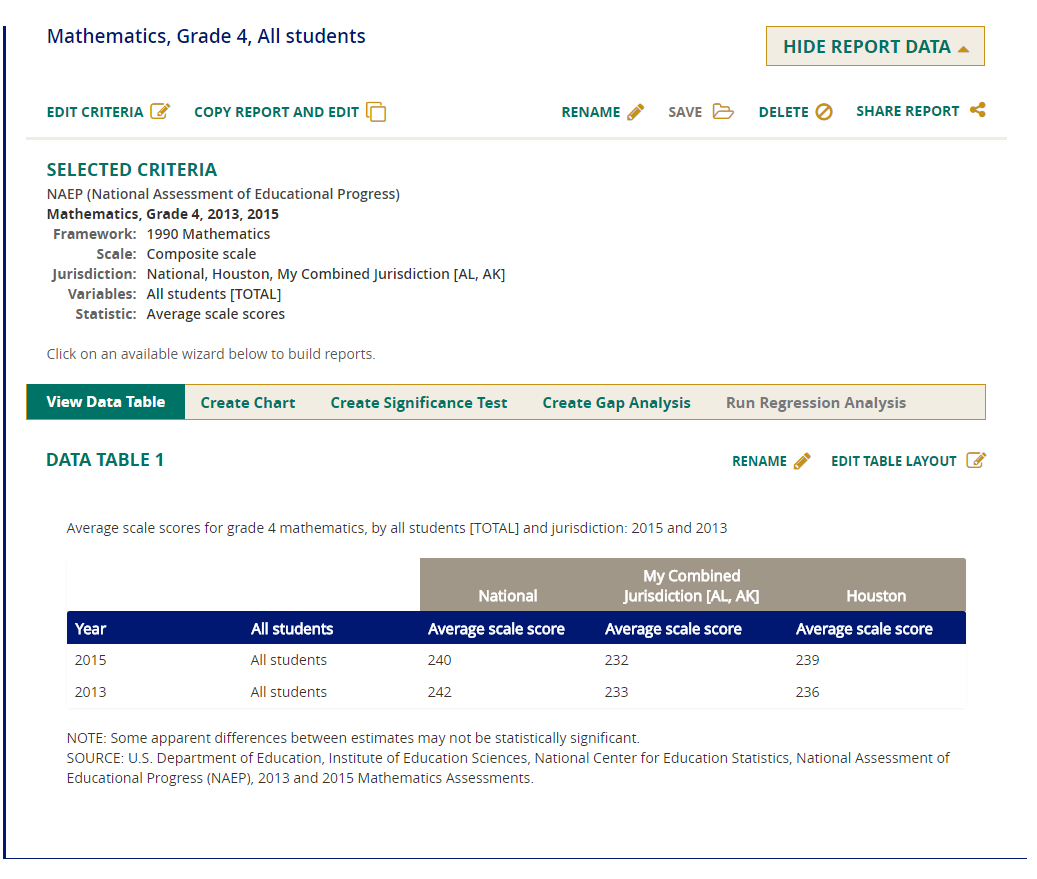
View Data Table
After you have clicked on Show Report Data, you will see a data table for your report. To change the format of the table, click on Edit Table Layout.
Once the data table has been generated, you will also be able to
- select the Create Chart tab to create and customize charts of the data,
- select the Create Significance Test tab to run a significance test on your results,
- select the Create Gap Analysis tab to test for gaps that are statistically significant for the variables in your report, and
- select the Run Regression Analysis tab to perform a regression analysis on your results.
NOTE: The availability of these tests depends on other selections you have made to define the content and format of your report.
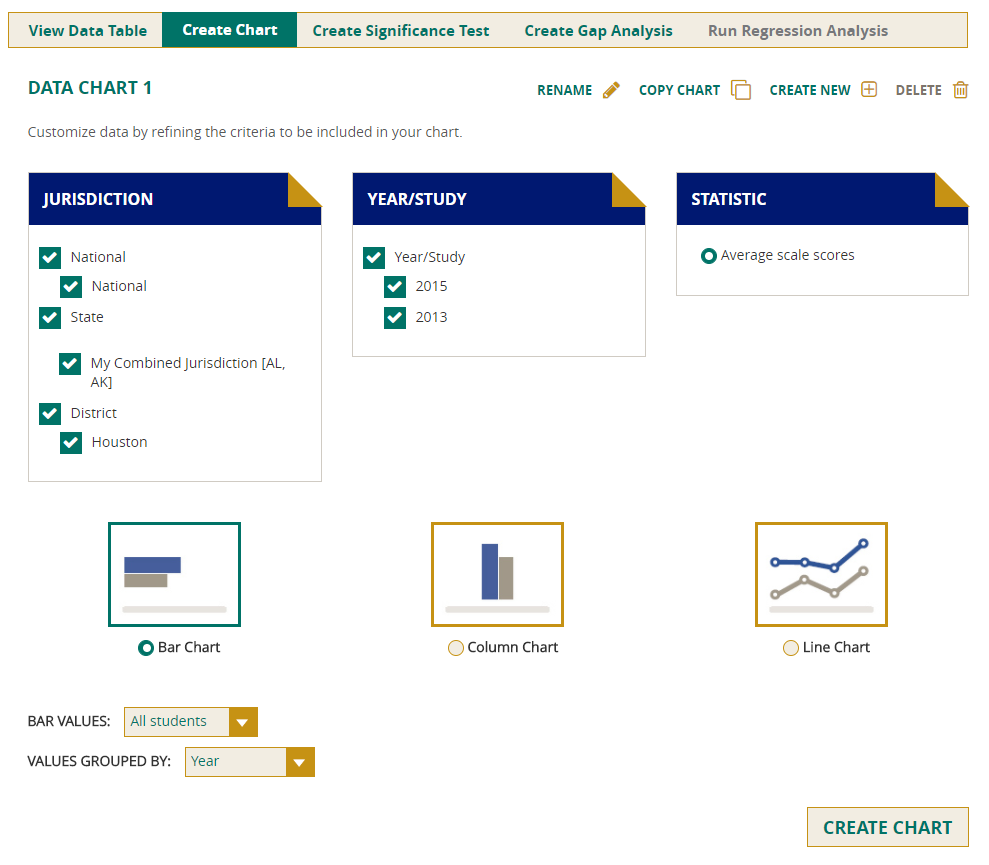
Create Chart
You can use the Create Chart feature to customize the data to be included in your charts. All of the jurisdictions and years that were included in the data table will be selected by default. You can only use one statistic in a chart, so determine whether your preferred one has been selected. Uncheck any of the other criteria that you do not wish to chart, as long as you have at least one box selected in each category.
The types of charts that are available include bar, column, line, percentiles, and achievement-level (cumulative and discrete) charts. Note that the percentiles chart is only an option when percentiles is selected as the statistic, and the cumulative and discrete charts are only options when achievement levels is selected as the statistic. Otherwise, only bar, column, and line charts will be available.
There are two drop-downs—Bar/Column/Line Values and Values Grouped By—which allow you to further customize the appearance of your charts. After making the desired selections in the drop-downs, click the Create Chart button at the lower right. Once the chart has been created, additional options may become available (e.g., the ability to choose a different column or value grouping than the one you selected initially).
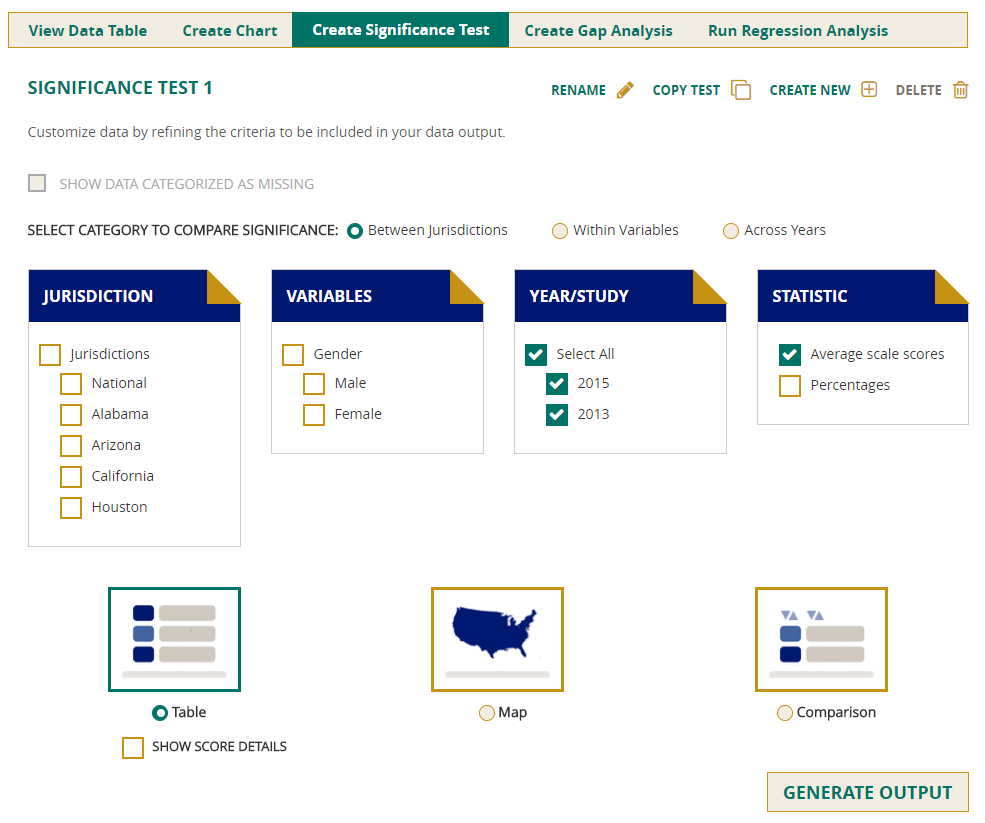
Create Significance Test
Tests for statistical significance are conducted to determine whether the differences between two result numbers are statistically significant. The term "significant" does not imply a judgment about the absolute magnitude or educational relevance of changes in student performance. Rather, it is used to indicate that the observed changes are not likely to be associated with sampling and measurement error, but are statistically dependable population differences. Results that are not significantly different should be ignored because they do not reflect real differences.
After you have generated your data table, click on the Create Significance Test tab. You can compare significance between jurisdictions, across the values within a variable (such as "male" and "female" within "gender”), or across years.
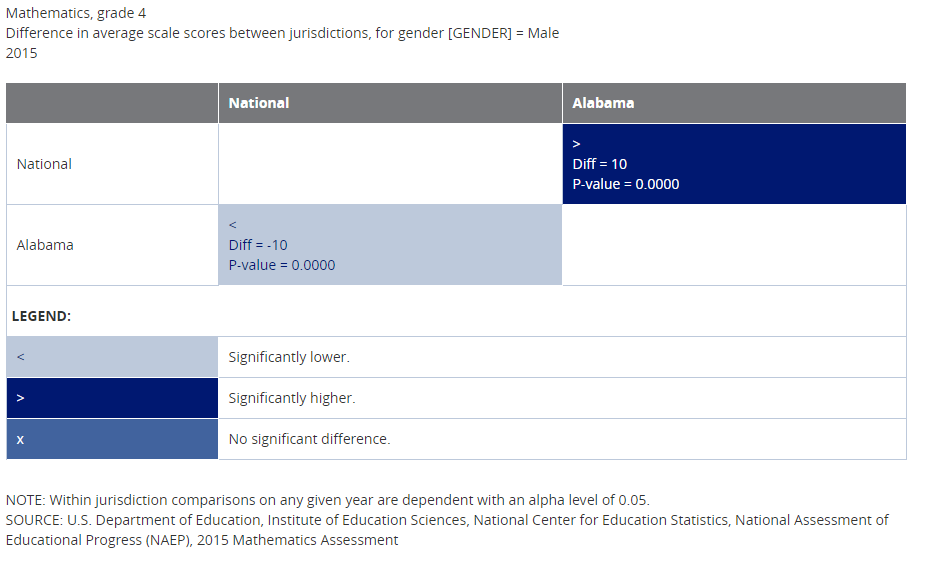
Make your selection from the categories Between Jurisdictions, Within Variables, or Across Years. Leave the default selection Table checked to receive output in that format. Then, choose the Jurisdictions, Variables, Years, and Statistic, and click on Generate Output.
Selecting Show Score Details will include the numerical value for each jurisdiction. You will see the matrix with the tests including the difference, P-value, and family size. All comparisons are independent tests with an alpha level of 0.05 adjusted for multiple pairwise comparisons according to the False Discovery Rate (FDR) procedure. For comparisons between two jurisdictions, a dependent test is performed for cases where one jurisdiction is contained in the other.
The family size is the number of significance tests that are performed simultaneously. The larger the family size, the more the significance level for each individual test is reduced in order to reduce the chance of claims about significant differences that are due to chance alone.
For more information on this topic, including comparing two groups, multiple comparisons, t-tests, the validity of inferences drawn from NAEP data, the Bonferroni procedure, the FDR procedure in NAEP, and related topics, see Drawing Inferences from NAEP Results at http://nces.ed.gov/nationsreportcard/tdw/analysis/infer.asp.
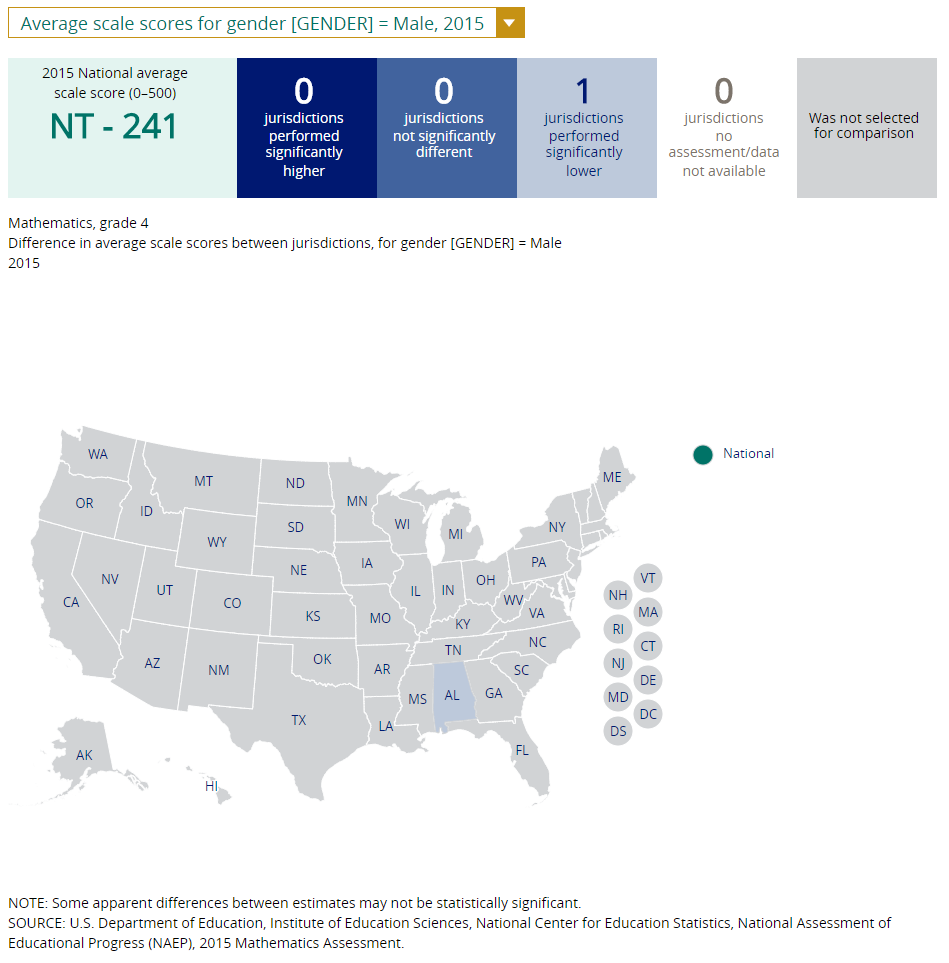
Maps
To produce a map of the U.S. showing states compared to national public and other states, or districts compared to large city and other districts, select output type Map instead of Table. You will not be able to select Show Score Details, because score details are already a part of the map output.
Create state maps using the default category Between Jurisdictions. Make your selection of Jurisdictions, Variables, Years, and Statistics, then click on Generate Output.
Once the map has been created, you will see scores or percentages when you mouse over the jurisdictions you tested for significance. If you want to change the focal jurisdiction, click on a different one. All comparisons will immediately be made against this new focal jurisdiction.
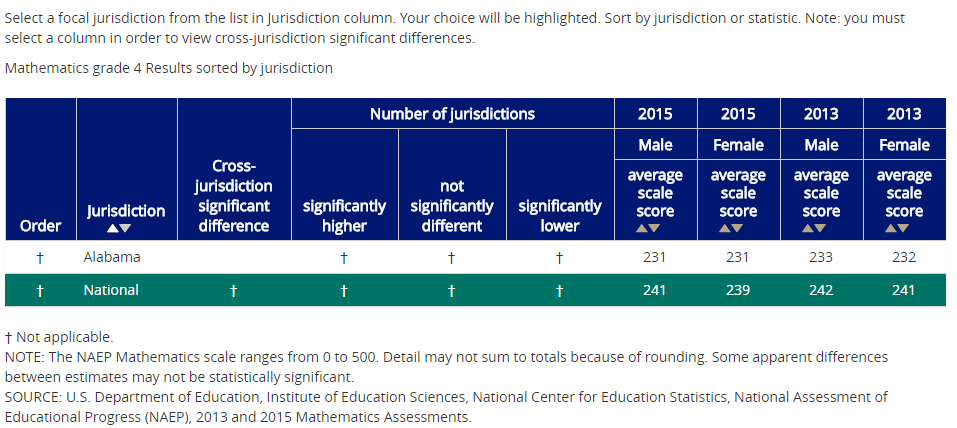
Comparisons
To obtain a comparison of states and national public, or districts and large city, select output type Comparison. Use the default category Between Jurisdictions to be able to generate these comparisons. Make your selection of Jurisdictions, Variables, Years, and Statistics, then click on Generate Output. You will be able to sort the information in the comparison chart from highest to lowest, with indications of states or districts with results that are significantly different from the focal jurisdiction.
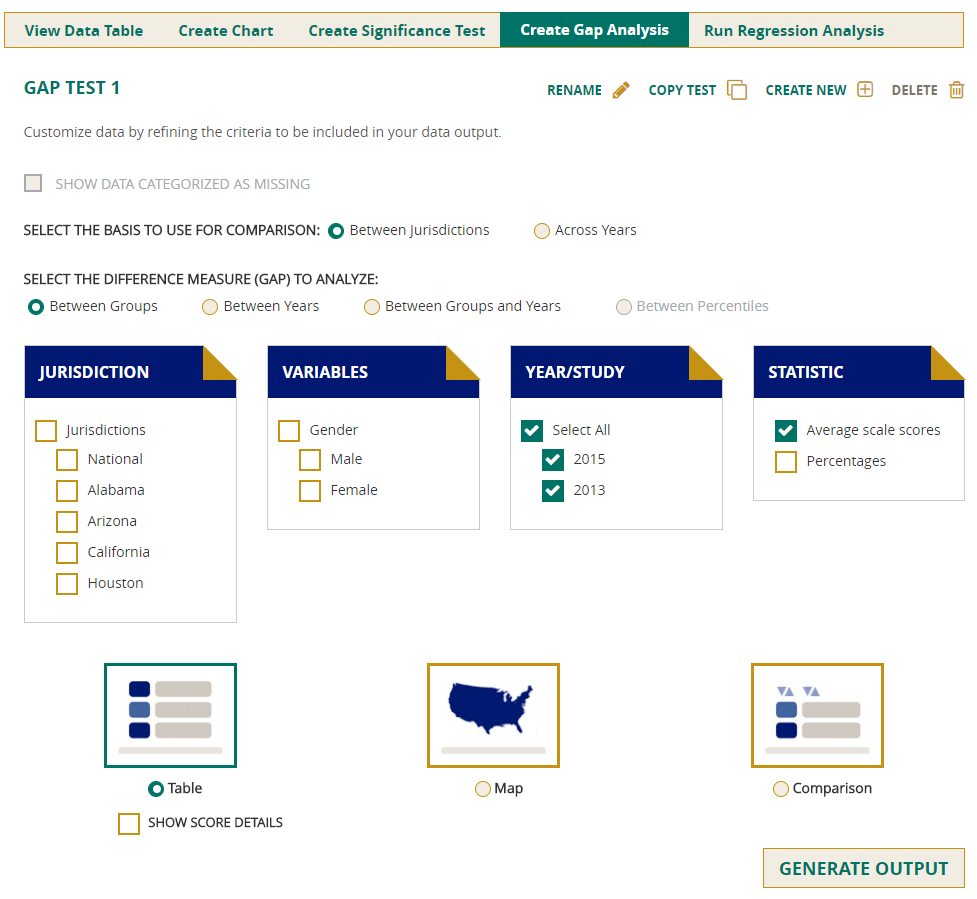
Create Gap Analysis
You can use the Create Gap Analysis feature to compare change across years in a table, or to compare jurisdictions on a map or in a comparison chart. Depending on your criteria, you will have a choice of either or both of these comparisons, Between Jurisdictions and Across Years.
Select the difference measure (gap) to analyze from the options available:
- Between Groups,
- Between Years,
- Between Groups and Years, and
- Between Percentiles.
Select the output type. Table is always available for selection, but Map or Comparison will not be available unless you have selected jurisdictions. Make your selection of Jurisdictions, Variables, Years, and Statistics, then click on Generate Output.
NOTE: A gap analysis across years cannot be combined with the Between Years or Between Groups and Years difference measures, so you will select the difference measure Between Groups, or, if you have selected percentiles as one of your statistics, you may choose Between Percentiles.
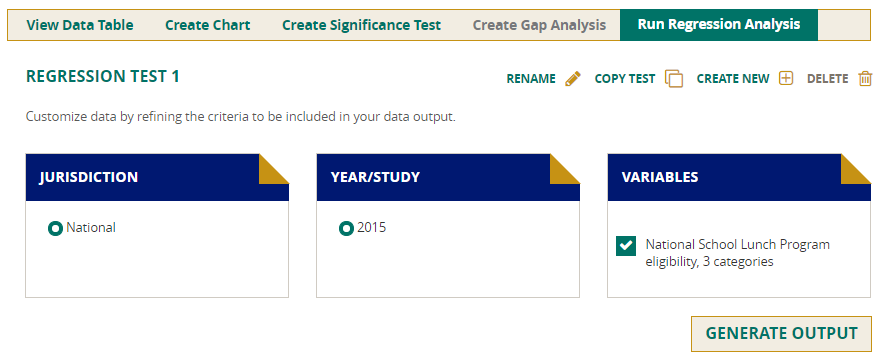
Run Regression Analysis
Select the Run Regression Analysis tab to conduct a linear regression of scale scores on selected independent variables for particular assessment years.
Once you have selected the Run Regression Analysis tab, you will have a choice of jurisdiction, year, and variables. After completing the selections, click Generate Output and the report will be produced.
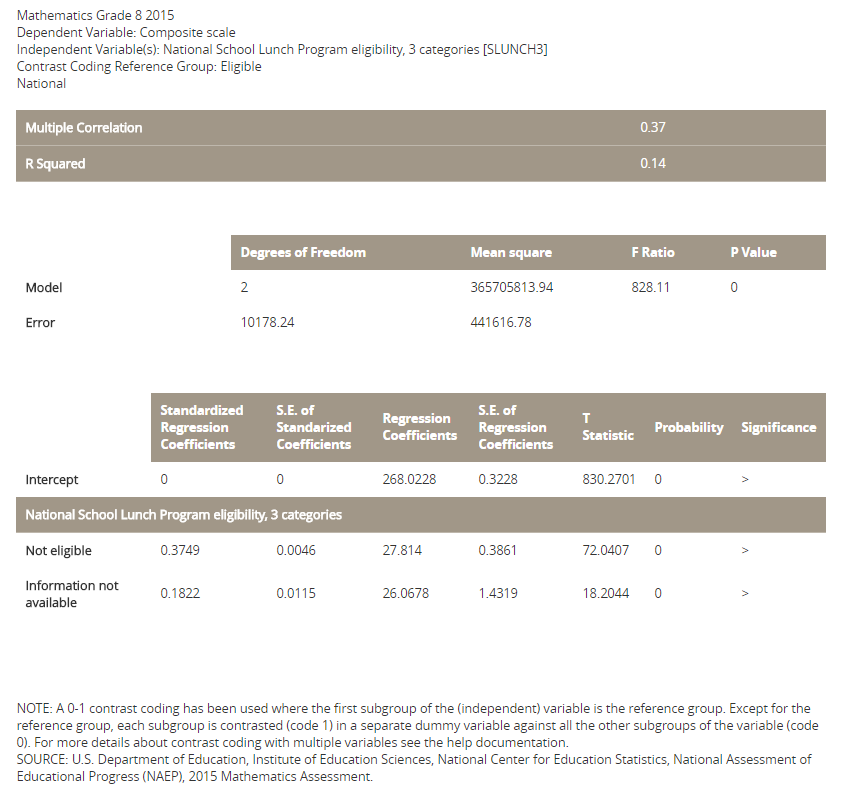
The report provides descriptive statistics (including correlations between the selected variables with the scale scores) as well as the typical results of a linear regression (including the R square and regression coefficients of the selected variables).
The independent variables are treated as non-ordinal categorical variables and dummy coded. The dummy coding is such that there is a regression coefficient for each category of the independent variables, except for the first category. The first category of each independent variable is used as the base category, and the regression coefficient for higher (focal) categories provides an estimate of the difference in scale score between the focal category and the base category, while holding all other variables constant. Consider the school lunch variable as an example. This variable has three levels: eligible for school lunch, not eligible for school lunch, and information not available. Taking the first level, eligible for school lunch, as the base category, the report shows the regression coefficients for the other two categories relative to the base category.
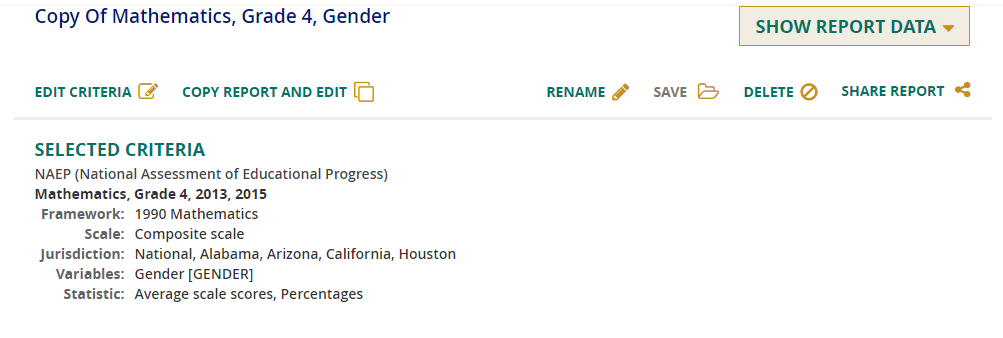
Edit Criteria/Copy Report and Edit
After you have selected the criteria for a report, you still have the opportunity—either before or after you click on Show Report Data—to edit the criteria of that particular report, or to copy the existing criteria to a new report and then make modifications.
To simply edit the criteria for a selected report, click on Edit Criteria and you will be returned to the prior screen where you made your original selections of Subject/Grade/Year/Scale, Jurisdiction, Variable, and Statistic.
Alternatively, if you prefer to keep the criteria selected for the original report and produce an additional report with some modifications, then click on Copy Report and Edit. A new report will be created and the name will begin with “Copy of.” This name can be changed by clicking on the Rename button and providing a new name that enables you to distinguish between the copy and the original report. Click Save, and then Edit Criteria to make the desired changes.
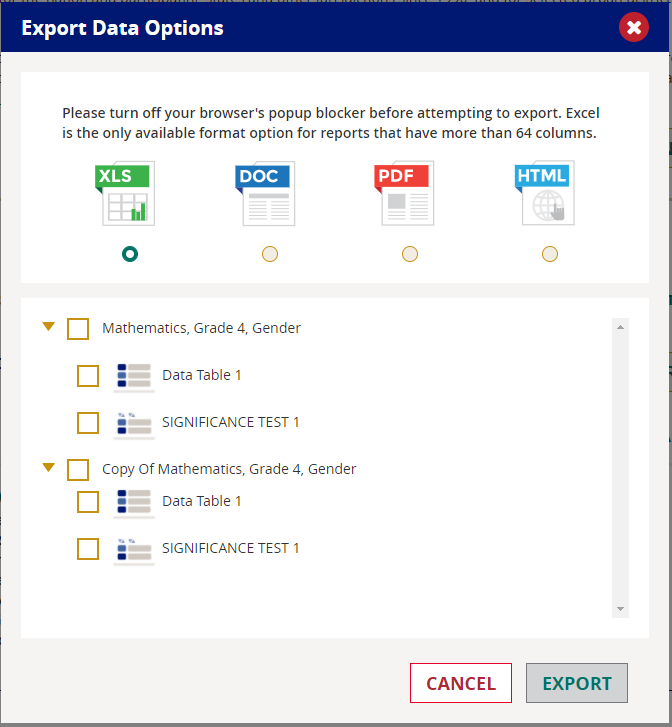
Export
Use the Export button to save your data tables, charts, significance tests, gap analyses, and regression analyses.
Click on the Export button and all of the reports that you have already generated will be listed. Check all those you wish to export, and select one of the available file types (Excel, Word, PDF, and HTML). Checking the report name will also select all of the components under it.
Once you have selected all of the reports you are interested in, click the Export button.
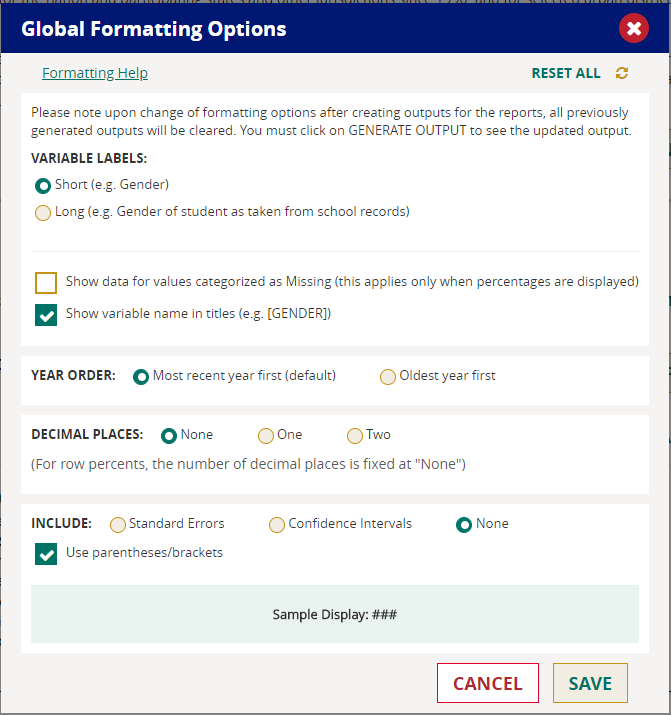
Global Formatting Options
Several global formatting options are available to help you customize your output and obtain all of the desired data in your preferred format. Categories to choose from include Variable Labels, Year Order, Decimal Places, and whether to include standard errors and confidence intervals.
Default values are already checked in the Global Formatting Options box. Choices with circles next to them require an option to be checked in that category. Choices with boxes next to them may each be either checked or unchecked.
Sharing Pages
You may want to share the NAEP Data Explorer with others. The Share Page button allows you to do so using Facebook, Twitter, email, or a direct link.

NAEP DATA EXPLORER DEFINITIONS
This section describes the kinds of criteria and variables that are used to form data queries, as well as the kinds of data available and statistical methods to assess them.
These topics include the following:
- Criteria
- Measures and Subscales
- Jurisdictions
- Variables
- Performance Metrics (scale scores, achievement levels and performance levels, percentiles, row percentages)
- Statistics Options
- Gaps
- Cross-tabulations
- Source, Notes, and Statistical Notation
- Statistical Data (standard deviation, standard error, confidence intervals)
CRITERIA
Each data query must include at least one selection from five criteria choices: subject, grade or age, measure(s), year(s), and jurisdiction(s). A query can include only one subject and grade or age at a time. It must include at least one, and can include more than one, type of measure, year, and jurisdiction. Descriptions of these criteria follow.
1. Subject:- Main NAEP: civics, economics, geography, mathematics, music, reading, science, technology and engineering literacy, U.S. history, visual arts, vocabulary, or writing;
- Long-Term Trend (LTT): mathematics or reading;
- High School Transcript Study (HSTS): mathematics or science; and
- National Indian Education Study (NIES): mathematics or reading.
- Main NAEP: grade 4, 8, or 12;
- LTT: age 9, 13, or 17;
- HSTS: grade 12 only; and
- NIES: grade 4 or 8 only.
4. Assessment Year(s): Defined as the year in which a given subject was assessed.
5. Jurisdiction(s):
- Data from Main NAEP, LTT, HSTS, and NIES: National
-
Data from Main NAEP only:
- Public and private schools,
- Regions of the country,
- States and equivalent assessment jurisdictions (in mathematics, reading, science, and writing only), and
- Selected urban districts (Trial Urban District Assessment [TUDA], in mathematics, reading, science, and writing only).
- NIES has some additional jurisdictions that are unique to that study.
NOTE: Main NAEP state assessments are conducted in the 50 states, the District of Columbia, and schools operated by the Department of Defense (DoDEA). Assessments have also been conducted in some years in Guam, Puerto Rico, the Virgin Islands, and American Samoa. Not all jurisdictions participate in all assessments.
MEASURES AND SUBSCALES
Subscales are constituent parts of an overall subject composite scale. For example, for science through 2005, the subscales were earth science, life science, and physical science. The weighted average of these is the basis for the science composite scale, as described in the science framework.
When new frameworks are approved, the subscales may change. For instance, in the 2009 science framework, the earth science subscale became earth and space sciences. Changes in subscales will be obvious in NDE if you select subscales for a subject for which they have changed.
If you need results for one or more subscales of a subject, realize that there are not as many data for them because the student samples are smaller.
Subscales are not reported for civics, music, visual arts, vocabulary, or writing, but are reported for these seven subjects: economics, geography, mathematics, reading, science, technology and engineering literacy, and U.S. history. Subscales are not available for long-term trend NAEP.
To get details about subscales for any subject, see the framework for that subject at http://nces.ed.gov/nationsreportcard/frameworks.asp.
JURISDICTIONS
To explore Main NAEP mathematics, reading, science, and writing, consider all the available categories of Jurisdictions: National, State, District, Territory/Other, and Region. Results for states, and since 2002 for selected urban districts, are available only for these assessments.
For civics, economics, geography, music, technology and engineering literacy, U.S. history, and visual arts, the only category available is National. For vocabulary, the categories National, State, and Region are available.
- National jurisdictions include National (both public and nonpublic schools), National public only, and National private only. Large city appears in this category when mathematics, reading, science, or writing is selected in order to serve as a benchmark for urban districts.
- State jurisdictions include the 50 states, the District of Columbia, and schools operated by the Department of Defense (DoDEA).
- District jurisdictions include all of the selected districts assessed since the Trial Urban District Assessment began in 2002. For more information, see https://nces.ed.gov/nationsreportcard/tuda/.
- Territory/Other refers to territories that volunteered to take NAEP before the 2002 reauthorization of the Elementary and Secondary Education Act (ESEA). In that reauthorization, all states, the District of Columbia, and Puerto Rico are to receive support for conducting NAEP. The territories of American Samoa, Guam, and the Virgin Islands conducted NAEP at their own expense for only a few years before 2002, and were not covered by the 2002 reauthorization.
- Region utilizes Census definitions since the 2003 assessment. A different definition of region was used up to 2002. Click on "view details" for a listing of the states in each region. Note that NIES uses a different definition of region than does main NAEP.
VARIABLES
In the NAEP Data Explorer, questions from three types of questionnaires (student, teacher, and school) as well as variables that are derived from several sources of background information, are organized into categories that have shared characteristics and can be selected as a group when examining and generating tables. For a given subject, grade, and jurisdiction combination there can be up to eight categories of information.
The categories are listed below and described briefly as an overall guide to the content in each category. Content categories and subcategories may overlap, but specific variables usually appear only once in a subcategory.
Main NAEP includes eight categories of variables:
- Major Reporting Groups
- Student Factors
- Instructional Content and Practice
- Teacher Factors
- School Factors
- Community Factors
- Factors Beyond School
- Government Factors
Each category contains subcategories, which contain the variables.
- Major Reporting Groups (includes subcategories Student Factors, School Factors, and Community Factors): Generally seen as the most important data in NAEP. Consisting of approximately a dozen variables, their availability depends on the assessment and criteria selected.
- Student Factors (includes subcategories Demographics, Affective disposition, Academic record and school experience): Data about students, their parents, students' level of interest and activity in school, student opinions about the subject being assessed, absenteeism, academic record, and school experience.
- Instructional Content and Practice (includes subcategories Curriculum, Course offerings, Classroom management, Grouping, and Modes of instruction/classroom activities): Course offerings, emphasis and time spent on topic matter, role of parents and guests in teaching, students' ability levels, modes of instruction, classroom activity, and computer use (not available in LTT).
- Teacher Factors (includes subcategories Demographics, Preparation, credentials and experiences, Attitudes/expectations, Teacher support, and Teacher satisfaction): Teacher race, teacher education and background, attitudes, expectations, availability of support for teachers, and teacher satisfaction. Teacher variables are not a part of LTT, and are not generally part of grade 12 assessments.
- School Factors (includes subcategories Demographics, Organization, Governance, Resources, School Culture, School Climate, Extracurricular activities offerings, and Charter School Supplement): Demographics, percentage of students taking particular classes or coursework, average class size and duration, school type, assignment of coursework by ability, governance, resources (computers, field trips, tech support, summer programs), test requirements for students, school climate, parental involvement, teacher morale, student attitudes, enrollment, safety, absenteeism, cheating, and extracurricular activities (not available in LTT).
- Community Factors (includes subcategory Demographics): Region of the country or school location.
- Factors Beyond School (includes subcategories Home regulatory environment, Time use outside of school, Family-school contact, and Peer relationships): Home environment, media at home, students' use of time outside school, homework, parents and homework, and more.
- Government Factors (includes subcategories State and District): State and district requirements for students (not in LTT).
NOTE: Long-term trend (LTT) NAEP provides only a subset of the variables available in Main NAEP.
PERFORMANCE METRICS
NAEP reports what students know and can do in terms of three performance measures: scale scores, achievement levels (or performance levels in LTT), and percentiles. All three measures are available in NAEP data tables, although some have different options. For more information, see the following subsections:
- Scale Scores
- Achievement Levels (Main NAEP)
- Achievement Levels as Independent Variables (Technical)
- Performance Levels (LTT)
- Percentiles
- Row Percentages
Scale Scores
For the main NAEP assessment, student performance is reported on National Assessment of Educational Progress (NAEP) scales, which range from 0–300 (for most subjects) or 0–500 (mathematics and reading only). Beginning with a new framework for grade 12 mathematics in 2005, results for grade 12 are reported on a 0–300 scale.
NAEP reports the average scale score for a variety of demographic samples of the student population—for example, the average scale score in mathematics for female students in the 8th grade in the nation’s public schools.
Scale scores can show the standard error (in parentheses) and are often accompanied by data on percentage and standard deviation.
For the long-term trend NAEP assessments, the scales are from 0–500 for mathematics and reading; but even though they have the same range, the LTT and Main NAEP scales are not related.
NAEP scales are produced using Item Response Theory (IRT) methods to summarize response patterns for each of the domains in each subject area in Main NAEP and long-term trend NAEP. That is, student responses to the assessment questions are analyzed to determine the percentage of students responding correctly to each multiple-choice question and the percentage of students achieving each of the score categories for constructed-response questions. Learn more about Scaling in the NAEP Technical Documentation at http://nces.ed.gov/nationsreportcard/tdw/analysis/index.asp.
NOTE: Prior to 2002 in Main NAEP, the scales for the state assessment were defined identically to, but separately from, those used for the scaling of the national data. Although the questions comprising each scale were identical to those used in the national assessment, the item parameters for the state assessment scales were estimated from combined public-school data from the jurisdictions participating in the state assessment program. Beginning with the 2002 assessment, a combined sample of public schools was selected for both state and national NAEP. One set of item parameters was estimated for the combined sample. See Technical Documentation at http://nces.ed.gov/nationsreportcard/tdw/analysis/scaling_models.asp.
Achievement Levels
Results for the Main NAEP assessments are reported using the achievement levels authorized by the NAEP legislation and adopted by the National Assessment Governing Board. The achievement levels are based on collective judgments about what students should know and be able to do relative to the body of content reflected in each subject-area assessment. For each subject area, three levels—Basic, Proficient, and Advanced—are defined for each grade, within scale score cut points.
Achievement-level data can be presented in two ways.
- Cumulative: the percentage of students performing at or above each achievement level. This includes students at all higher levels. These categories are percentages of students scoring below Basic, at or above Basic, at or above Proficient, and at Advanced.
- Discrete: the percentage of students performing within each achievement level, counted separately from the other levels. These categories are the percentages of students scoring below Basic, at Basic, at Proficient, and at Advanced.
In the NAEP Data Explorer, achievement levels may be selected as variables, but then the only statistic available will be percentages. If achievement levels are selected instead as one of your two statistics choices, then you have the choice of one other statistic: Average Scale Scores, Percentages, Percentiles, or Standard Deviations.
When Achievement Levels is selected as a variable, with percentages the only statistic, you will not be able to move Jurisdictions, Years, or Achievement Levels to the Column area of your table. NDE will give you an error message in that case. Read more in the section Achievement Levels as Independent Variables (Technical).
The definition for each achievement level was developed by a broadly representative panel of teachers, education specialists, and members of the general public. Subject- and grade-specific detailed definitions are available in each subject section on this site. The policy definitions of the levels are:
- Basic—This level denotes partial mastery of prerequisite knowledge and skills that are fundamental for Proficient work at each grade.
- Proficient—This level represents solid academic performance. Students reaching this level have demonstrated competency over challenging subject matter.
- Advanced—This level represents superior performance.
As provided by law, the Commissioner of Education Statistics has determined that the achievement levels are to be used on a trial basis and should be interpreted and used with caution. However, both the Commissioner and the National Assessment Governing Board believe these performance standards are useful for understanding trends in student achievement.
NOTE: The NAEP long-term trend assessment does not use achievement levels, but uses a similar metric called “Performance Levels.”
Achievement Levels as Independent Variables (Technical)
NDE permits achievement levels to be selected as variables. Using achievement levels as variables, you ask the question, “Of those students who score at a given level, what percentage of the sample falls into each of the categories of the background variable?” For example, of those students who are Proficient, what percentage are English-language learners? Technical details follow.
Suppose we have a variable  with
with 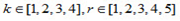 , that represents the percentage of students in student group g that demonstrates proficiency at one of k mutually exclusive levels based on plausible value r relative to all students that demonstrate proficiency at that level k. In reality, both k and r are dynamic, but ‘hard-coded’ here for ease of illustration.
In formula:
where  assumes the value 1 if student i performs at level k based on plausible value r and assumes the value 0 otherwise. Also, N indicates all students in the sample, whereas
  only indicates those students in group g. Hence, the numerator is a sum over students in group g, whereas the denominator is a sum over all students.
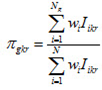
Note that the denominator depends on r and therefore changes with each plausible value. The average across plausible values is used as the estimate of the percent. Hence, we would display (x100)

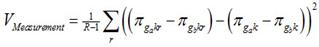
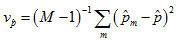
where R is the total number of plausible values. Subsequently, the measurement variance of this estimate can be computed as:
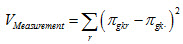
Furthermore, instead of using weight  also a replicate weight
  can be used, where u assumes values from 1 to 62 (it should be considered dynamic though). Hence, a replicate estimate of the percentage
  for replicate u can be computed, using the first plausible value, as
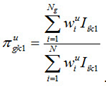
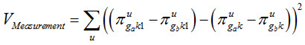
and the sampling variance can then be computed as
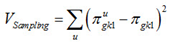
after which both components can be combined in the usual way.
Note that following the above, the variance and, square rooted, the standard error are in a 0–1 metric and need to be transformed to a 0–100 metric.
Example
Take the following table of classifications.
Table 1
| Plausible Value | 1 | 2 | 3 | 4 | 5 |
| Below Basic | 220 | 190 | 210 | 203 | 187 |
| At Basic | 410 | 408 | 388 | 421 | 432 |
| At Proficient | 282 | 331 | 321 | 298 | 304 |
| At Advanced | 88 | 71 | 81 | 78 | 77 |
| Total | 1,000 | 1,000 | 1,000 | 1,000 | 1,000 |
Adding Male-Female distributions to the “At Basic” row would yield Table 2.
Table 2
| Plausible Value | 1 | 2 | 3 | 4 | 5 | |||||
| Below Basic | 220 | 190 | 210 | 203 | 187 | |||||
| At Basic | M 208 |
F 202 |
M 198 |
F 210 |
M 192 |
F 196 |
M 201 |
F 220 |
M 224 |
F 208 |
| 410 | 408 | 388 | 421 | 432 | ||||||
| At Proficient | 282 | 331 | 321 | 298 | 304 | |||||
| At Advanced | 88 | 71 | 81 | 78 | 77 | |||||
| Total | 1,000 | 1,000 | 1,000 | 1,000 | 1,000 | |||||
Hence, the percentage of Females in the At Basic group is: 202/410, 210/408, 196/388, 220/421, and 208/432. On average, this is 50.3% with a maximum of 52.3% and a minimum of 48.1%.
Dependent Differences
Standard errors for dependent differences between groups of students can be computed by taking the difference of the percent at an achievement level for each plausible value for the two groups of interest and then computing the variance across those. The Jackknife follows commensurate based on the first plausible value. In formulae:
where ga and gb denote groups a and b. These are then combined in the usual way.
Performance Levels
For NAEP long-term trend, to facilitate interpretation of the results, the scales were divided into successive levels of performance, and a “scale anchoring” process was used to define what it means to score in each of these levels. NAEP’s scale anchoring follows an empirical procedure whereby the scaled assessment results are analyzed to delineate sets of questions that discriminate between adjacent performance levels on the scales.
For the reading and mathematics trend scales, these levels are 150, 200, 250, 300, and 350. For these five levels, questions were identified that were likely to be answered correctly by students performing at a particular level on the scale and much less likely to be answered correctly by students performing at the next lower level. The guidelines used to select such questions were as follows: students at a given level must have at least a specified probability of success with the questions (65 percent for mathematics, 80 percent for reading), while students at the next lower level must have a much lower probability of success (that is, the difference in probabilities between adjacent levels must exceed 30 percent). For each curriculum area, subject-matter specialists examined these empirically selected question sets and used their professional judgment to characterize each level. The reading scale anchoring was conducted on the basis of the 1984 assessment, and the scale anchoring for mathematics trend reporting was based on the 1986 assessment.
The NAEP Data Explorer can provide cumulative or discrete performance levels.
- Cumulative performance levels display the percentage of students who performed at or above specific levels of performance. Although there are five performance levels, the results displayed for each age group are those that are most likely to show significant change across the years: Levels 150, 200, and 250 for age 9; levels 200, 250, and 300 for age 13; and levels 250, 300, and 350 for age 17. Segments are tallied cumulatively; for example, 9-year-olds who perform at or above the 200 level are counted as part of the at or above 150 level. Nine-year-olds whose performance was at level 250 also performed at or above level 150 and at or above level 200. Percentages, therefore, do not sum to 100.
- Discrete performance levels display the percentage of students performing at three discrete levels, based on the levels that are most likely to show significant change across the years, as for cumulative performance levels described above. These results sum to 100 (within rounding error).
Percentiles
Percentile data show the NAEP scale score attained by students performing at higher, middle, and lower ranges of the distribution. In NAEP, the percentile is defined by the percentage of students scoring lower than a particular scale score.
For example, if the 25th percentile is 281, it means that 25 percent of the students scored below 281. Percentile changes over time help indicate trends in how students perform at higher and lower levels.
In the NAEP Data Explorer, scale score performance data are available for student groups at the 10th, 25th, 50th, 75th, and 90th percentiles.
Row Percentages
Row percentage indicates the proportion of students represented in the table cell—that is, the number of students represented in a particular cell of the table, divided by the number of students in the row of the table, converted to a percentage. For example, if the row percentage for Black female students is 22%, then Black females composed 22 percent of the total number of students assessed. Technically, row percentage is not a performance metric, but is used to report achievement levels and performance levels.
STATISTICAL SPECIFICATIONS
The NAEP Data Explorer reports several kinds of information about the statistics:
- Standard Deviation
- Standard Error
- Confidence Intervals
- Confidence Intervals: NDE Statistical Specification
- Dependent t-Tests: NDE Statistical Specification
STANDARD DEVIATION
The standard deviation represents a measure of how widely or narrowly scores are dispersed for a particular data set. Specifically, it is the square root of the average squared deviation of scores about their arithmetic mean.
Under general normality assumptions, 95% of the scores are within 2 standard deviations of the mean. For example, if the average score of a data set is 250 and the standard deviation is 35 it means that 95% of the scores in this data set fall between 180 and 320.
In the NAEP Data Explorer, you may obtain Standard Deviations as one of your two choices for Statistics Options in Edit Reports.
NOTE: For use of the standard deviation in NAEP, search the NAEP Technical Documentation at http://nces.ed.gov/nationsreportcard/tdw/query.asp
STANDARD ERROR
Standard error is a measure of sampling variability and measurement error for a statistic.
NAEP computes standard error using a combination of sampling error based on Jackknife Repeated Resampling (JRR) and measurement error from the variance between plausible values.
For student groups reported in NAEP, because the percentages of students and their average scale scores are based on samples rather than on the entire population of fourth-, eighth-, or twelfth-graders in the nation or a jurisdiction, the numbers reported are estimates. As such, they are subject to a measure of uncertainty, reflected in the standard error of the estimate. When the percentages or average scale scores of certain groups are compared, the standard error should be taken into account, and observed similarities or differences should not be relied on solely. Therefore, the comparisons presented in the data tables are based on statistical tests that consider the standard errors of those statistics and the magnitude of the difference among the averages or percentages.
See NAEP Analysis and Scaling at http://nces.ed.gov/nationsreportcard/tdw/analysis/.
NOTE: To discover uses of standard errors in NAEP analysis, search for the term in the Technical Documentation on this website at http://nces.ed.gov/nationsreportcard/tdw/query.asp.
CONFIDENCE INTERVALS
The NAEP Data Explorer user should rely on the results of statistical significance tests rather than on the observed magnitude of the difference between sample averages or percentages when determining whether the sample differences are likely to represent actual differences among the groups in the population.
Using confidence intervals based on the standard errors provides a way to take into account the uncertainty associated with sample estimates, and to make inferences about the population averages and percentages in a manner that reflects that uncertainty. An estimated sample average scale score plus or minus two standard errors approximates a 95 percent confidence interval for the corresponding population quantity. This statement means that one can conclude with approximately a 95 percent level of confidence that the average performance of the entire population of interest (e.g., all fourth-grade students in public schools in a jurisdiction) is within plus or minus two standard errors of the sample average.
Similar confidence intervals can be constructed for percentages, provided that the percentages are not extremely large or extremely small. For percentages, standard errors are most accurate when sample sizes are large and the percentages being tested have magnitude not relatively close to 0 or 100 percent.
Confidence intervals are available for your NAEP tables via the Global Formatting Options.
NOTE: Find out more about the use of confidence intervals in NAEP by searching at http://nces.ed.gov/nationsreportcard/tdw/query.asp and by reading about comparisons beginning at http://nces.ed.gov/nationsreportcard/tdw/analysis/infer.asp.
CONFIDENCE INTERVALS: NDE STATISTICAL SPECIFICATION
Statistical testing is based on confidence intervals. In the calculation of confidence intervals, a separate procedure is required for each of four types of weighted statistics: means, student group distribution proportions, achievement-level proportions, and percentiles.
Means
For weighted means, denoted as  , the confidence interval takes on the form:
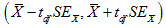
where  is the 97.5th quantile of the t-distribution with degrees of freedom as estimated following the usual formula of
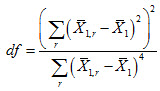
where r denotes the mean based on replicate weight r and the index 1 denotes that the first plausible value is used for this computation. The Johnson-Rust adjustment needs to be applied to the df result.
Furthermore,
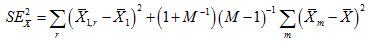
where m denotes the plausible value and is the average over plausible values.
Student Group Proportions
The method of choice for proportions is a method derived by Wilson. Wilson’s approach takes on the following (asymmetric) form:
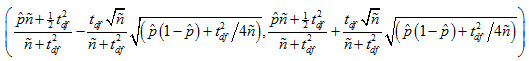
There are three variables in this equation:
 is the estimated achievement level proportion,
 is the effective sample size, which is computed as
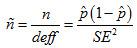
where n is the weighted sample size of the sample (NOT the population estimate). When the proportion observed in the sample is 0, then the limits have to be evaluated. Since the denominator is a squared term, it will reach 0 quicker than the numerator and, thus, the effective sample size becomes infinite. Hence, an additional restriction is placed which is that  , which basically means that in very small samples the design effect is 1. The logic is that in very small samples students are approximately at random distributed. Empirically it can be verified that in relatively small samples, unless a specific clustering exists, the design effect is relatively close to 1.
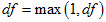
is the t-distribution with df degrees of freedom.
Note that the number of degrees of freedom does not exist when the proportion is zero. By inspecting the limits, the denominator goes to zero faster than the numerator. Instead, a t-distribution with one degree of freedom may be chosen, i.e.,
Achievement-Level Proportions
For achievement-level proportions the same procedure as above is followed except that the standard error also has to take into account the variance due to measurement. This component can be easily added to the design effect to decrease the effective sample size and increase the variation accordingly. Specifically, this component is
where  is the proportion estimate based on the mth plausible value, and the average of that is the estimated proportion
  .
.
This component is expected to be very small since the proportion is a summary statistic, which are generally quite stable across plausible values unless a particular small group is queried. The effective n is:
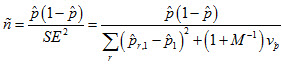
where r is the index for the replicate weight and 1 denotes that the first plausible value is used. The formula of the interval is similar to that for student group proportions, including the adjustments for minimum design effects and degrees of freedom.
Percentiles
Percentiles can be computed using many of the same techniques as above. This approach is somewhat different from the current approach.
- Both standard error components can be found by finding the student who is exactly at the pth percentile (or by using the usual extrapolation if such a student does not exist) and finding this student's proportion (if ranked) across replicate weights and plausible values.
- Then, first a lower and upper bound can be found accounting for measurement.
- Subsequently, the Wilson formula can be applied similar as with achievement-level proportions.
- After finding the final lower and upper bounds for the proportion, the average plausible value can be used to translate these bounds into bounds in the percentile scale.
Again, the same adjustments for small proportions are used, although these will usually not be an issue as the exact percentile is known (i.e., manipulated). Note that the weight of a particular student at the pth percentile may be zero for a particular replicate weight and therefore equal to the student below him or her with a non-zero weight.
DEPENDENT T-TESTS: NDE STATISTICAL SPECIFICATION
In NAEP, t-tests are independent unless there is a part-whole comparison, where one jurisdiction is part of another one. Under the enhancement, additional dependencies are being taken into consideration. These pertain to part-part comparisons, where two jurisdictions might share some but not all of their sample/population, and dependencies between subgroups. The following table holds.
| Situation | Comparison | Dependence | Standard Error and Degrees of Freedom Equation |
| I | Across years | Independent | Pooled |
| II | Between mutually exclusive jurisdictions | Independent | Pooled |
| III | Between student groups | Dependent | Dependent via Differences |
| IV | Between non-mutually exclusive jurisdictions where one is fully subsumed in the second | Dependent | Dependent via either (a) Differences or (b) Part-whole equation |
| V | Between non-mutually exclusive jurisdictions that both share some, but not all of their sample/population | Dependent | Dependent via (a) Differences or (b) Part-part equation |
Under the current infrastructure, the t-test module either handles STATS or SUMS.
STATS is a series of statistics that can directly be used to compute a t-value and a p-value.
SUMS produce a set of intermediate replicate weights or plausible value-based statistics that together can be combined to compute a t-value and a p-value.
STATS are typically used for situation I, II, IV(b), and V(b) while SUMS are typically used for situation III, IV(a), and V(a). Requests typically behold a combination of situations. The current architecture only supports either STATS or SUMS within a single table. This might not be the case indefinitely. Formulae IV(a) and IV(b) are approximately equivalent, except for some mild, reasonable assumptions in (b). Therefore, these two formulae might not yield the exact equivalent results, although they should be expected to be close. This is also true for V(a) and V(b).
STATS
Pooled
For independent comparisons, a simple pooled standard error or
can be computed for years g and h or mutually exclusive jurisdictions g and h.
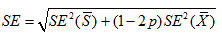
Part-whole
Suppose that the largest jurisdiction, the whole, is S and the smaller, the part, is X. Also, p is the weighted proportion of X into S. As a Venn-diagram, this could be represented as follows:
Then,
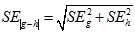
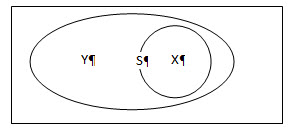
Part-part
Suppose that one jurisdiction is S and the other is X. Also, Q is the overlapping part and p1 is the weighted proportion of Q into S and p2 is the weighted proportion of Q into X. As a Venn-diagram, this could be represented as follows:
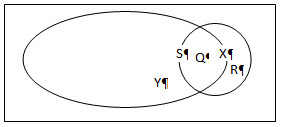
Then,
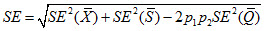
This would obviously require that the standard error for Q is part of the STATS.
SUMS
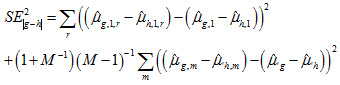
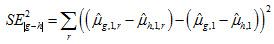
Dependent via Differences
For dependent comparisons, the standard error of the difference needs to be computed. Suppose that  and
and  are the (weighted) mean, achievement-level proportion, or percentile estimates for groups g and h, where these indexes can point to either jurisdictions (including nation and TUDAs) or student groups.
Furthermore, there are m=(1,2,...m,m+1,...M) plausible values (usually 5), hence,

Also, there are r=(1,2,...,r,r+1,...,R) replicate weights, hence, the mean based on replicate weight r is denoted  . Then, the standard error takes on the following form:
(1)
For (weighted) student group distribution percentages, the second term on the right-hand side is equal to 0. Hence,
(2)
For proportions associated with achievement levels as independent variable equation (1) applies, where
is the average subgroup percentage across the plausible values for group g as will be reported as statistic in the table,
 is the percentage for plausible value m, and
 is the percentage for group g, based on the first plausible value and based on jackknife replicate weight r.
Degrees of Freedom – Dependent via Differences
For differences of dependent groups, the degrees of freedom follow from the usual computation, except that no pooling is conducted. Hence,
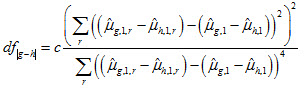
where c is the usual Johnson-Rust correction, defined as:
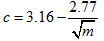
and m is the number of jackknife replicates, which we currently set at 62 for all comparisons in this particular correction factor.
Application to Statistics
Below is a summary table to indicate what components factor into the standard error computation and, thus, whether equation (1) or (2) should be used.
| Statistic | Plausible Values | Jackknife | Equation |
| Mean | Yes | Yes | (1) |
| Achievement Level | Yes | Yes | (1) |
| Percentile | Yes | Yes | (1) |
| Subgroup percentage | No | Yes | (2) |
| Achievement level as independent variable, yielding a subgroup percentage | Yes | Yes | (1) |
For more information, see the NAEP Technical Documentation at http://nces.ed.gov/nationsreportcard/tdw/analysis/infer.asp.
CROSS-TABULATIONS
Cross-tabulation is a method of combining separate variables into a single table. You may select up to three variables (other than the variable All students) for each crosstab you would like to create, and then generate the single table by using the Create Crosstab feature in the Variable section.
SOURCE, NOTES, AND STATISTICAL NOTATIONS
Statistical notation is found at the end of a data table, if applicable to that table:
— Not available.
† Not applicable. (For instance, the statistic does not meet reporting standards, so the measure of dispersion for that statistic cannot be reported.)
‡ Reporting standards not met. (For instance, the sample size is insufficient to permit a reliable estimate.)
# The statistic rounds to zero.
NOTE: Pertains to any special characteristics of the data in the table.
SOURCE: Information is listed for all NAEP data, below the table or chart, and should be cited when data are used in a publication or presentation.