|
Close window
HELP
How do I ... ?
Navigate the High School Transcript Study website
The content in the High School Transcript Study (HSTS) website can be assessed at any time using the left hand navigation bar. The left navigation bar allows you to select results in any order. Alternatively, you can use the arrows in the upper left hand corner to move through the website page by page.
Use the navigation bar to do the following:
- Explore results for courses taken, grade point average (GPA), or NAEP scores;
- See results for student groups;
- Find out information about the HSTS; and
- Download a copy of the print HSTS report.
There are two ways to explore these results on this website:
-
Examine course taking patterns, GPA, and NAEP scores for all graduates and select student groups; or
-
Examine results for a student group, exploring course taking patterns, GPA, and NAEP scores for that student group.
Tabs allow you to explore in depth the results for courses taken, GPA, NAEP scores, and student groups. There are upper tabs and lower tabs.
When exploring results for courses taken, GPA, or NAEP scores, use the upper tabs to select specific information about these topics. Use the lower tabs to view these results by select student groups. The tabs that you have selected are always shaded.
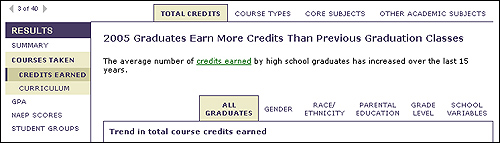
For example, these selections will access total credits earned for all graduates.
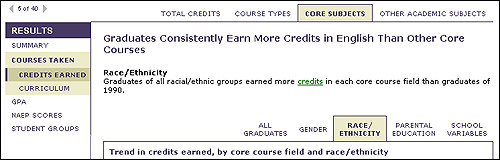
And these selections will access credits earned in core subjects by race/ethnicity.
When exploring results for student groups, use the upper tabs to jump to results for the major HSTS variables. Use the lower tabs to explore more specific information about each of these topics.
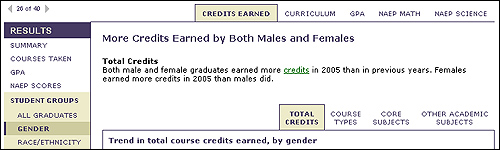
For example, these selections will access results for males and females on the total credits earned in high school.
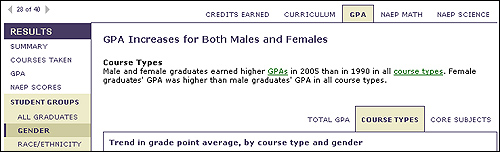
And these selections will access results for GPA by types of courses for males and females.
Some line charts showing the performance trends of student groups have several variables to compare and/or have overlapping lines. So that you can focus on a specific comparison or group, the graphics on this website use Macromedia® Flash (requires a free Flash player), allowing you to view the data in different ways.
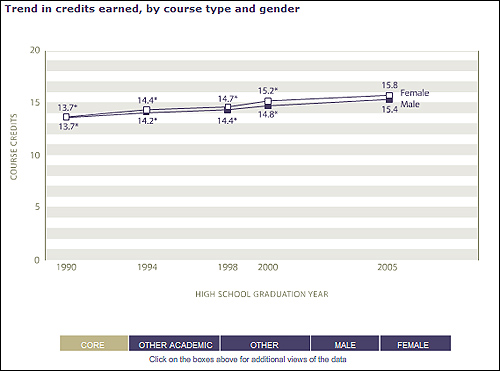
For example, as shown below, when examining credits earned by course type and gender, you can compare each course type by gender, or compare all course types for males or for females.
By selecting the CORE you can compare the results for males and females on credits earned in core courses.
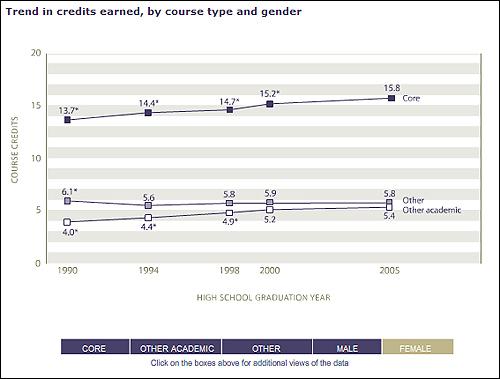
By selecting FEMALE you can compare the trend in credits earned in core, other academic, and other courses for females.
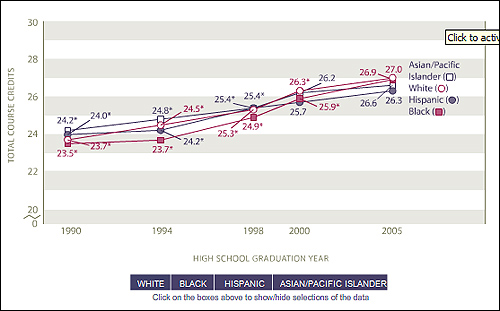
In other graphs with overlapping lines, you can show or hide data for various groups, as shown below.
Here you can click on the boxes to remove (or add back) lines for student groups where they are overlapping.
Download recommended Flash Player
 The NAEP website presents certain material in the form of Flash animations. In order to view these animations, you will need to install a Macromedia Flash Player, version 7 or higher. Refer to Macromedia's Flash support center for assistance in working with the Flash Player. The NAEP website presents certain material in the form of Flash animations. In order to view these animations, you will need to install a Macromedia Flash Player, version 7 or higher. Refer to Macromedia's Flash support center for assistance in working with the Flash Player.
Close window
|